


Most people pick a health plan by staring at the monthly premium and crossing their fingers on everything else. That is exactly how you end up paying for coverage you barely touch, or how the plan that looked cheap hands you a five-figure bill the first time something actually goes wrong. The premium is only one of five numbers that decide what a year of care really costs you, and the health insurance cost that matters is the total: what you pay in premiums plus what you pay out of pocket. Pick the wrong plan and you rarely lose a few dollars; you can lose thousands you never planned for.
The stakes climbed in 2026, and not in your favor. The enhanced premium tax credits that capped Marketplace premiums at 8.5% of income expired at the end of 2025, and under current law the old 400% federal-poverty-level subsidy cliff is back, so one raise or a good freelance year can wipe out your help entirely and leave you owing money at tax time. Whether you get employer-sponsored health insurance, shop the ACA Marketplace, or weigh a high-deductible health plan with an HSA, the rules just got less forgiving, and open enrollment is the one window where you have to live with the choice for a full year.
So here we take how health insurance works apart one number at a time, from the deductible to the out-of-pocket maximum. Then we line up every realistic way to get covered and hand you a five-step framework you can run in an afternoon, before your next enrollment window closes on you.
1. How a Health Insurance Plan Actually Works
A plan summary looks intimidating, but strip away the jargon and it is really just a handful of moving parts having technical names. So what do those five words (premium, deductible, copay, coinsurance, and out-of-pocket maximum) actually cost you, and how do they add up across a full year? We define each lever, watch them play out over twelve months in real dollars, see how the network changes the bill, then clear up the two confusions that trip people up most.
1.1 The Five Cost Levers: Premium, Deductible, Copay, Coinsurance, and the Out-of-Pocket Maximum
Start with the premium, because it is the number most people fixate on. The premium is the fixed monthly charge you pay to keep coverage, whether you see a doctor twelve times this year or not at all. Here is the first thing to get right: the premium never counts toward your deductible or your out-of-pocket maximum. It buys the coverage, nothing more.
The deductible is what you pay for covered services before the plan starts paying its share. A few services sit outside it, preventive care most importantly, but for everything else you are spending your own money until you clear that number. The copay is the flat dollar charge per service, $30 for an office visit, for example. So how does that work alongside the deductible? Some copays apply before you have met it and some after, depending on what the plan documents spell out.
Once you clear the deductible, coinsurance takes over. This is your percentage share of the bill, often 20%, with the plan picking up the other 80%. That split keeps running until you reach the out-of-pocket maximum, the annual ceiling on everything you pay in cost-sharing. After you hit the out-of-pocket maximum, the plan pays 100% of covered in-network care for the rest of the year. Knowing how a health insurance deductible works is half the battle, and the table below shows you exactly where each dollar lands.
| Cost lever | When you pay it | Counts toward deductible? | Counts toward OOP max? |
|---|---|---|---|
| Premium | Every month | No | No |
| Deductible | Before plan pays | n/a (it is the deductible) | Yes |
| Copay | Per service | Sometimes | Yes |
| Coinsurance | After deductible | n/a | Yes |
| Balance bill (out-of-network) | After service | Usually no | Usually no |
These are structural definitions, so the figures do not go stale. The line worth remembering is the top row: your premium sits entirely outside both ceilings, which is exactly why a low premium can hide an expensive plan.
1.2 Follow One Claim Through Your Plan
Definitions are one thing, but the levers only click into place once you watch a single bill move through them. So what actually happens, step by step, between the moment you get care and the moment the plan takes over?
Say you receive a covered, in-network service. The provider does not bill you their sticker price; they bill the plan’s negotiated rate, which is lower. The plan then applies your deductible, so you pay out of pocket until you have met it. Once the deductible is satisfied, coinsurance kicks in: you pay your share, say 20%, and the plan pays the rest. With each claim the plan checks your running total against the out-of-pocket maximum, and the moment you hit it, the plan pays 100% for the rest of the year. This is where your dollars stop and the insurer’s begin, and it answers the question that catches so many people off guard: why you can still get a bill after you have paid your deductible.
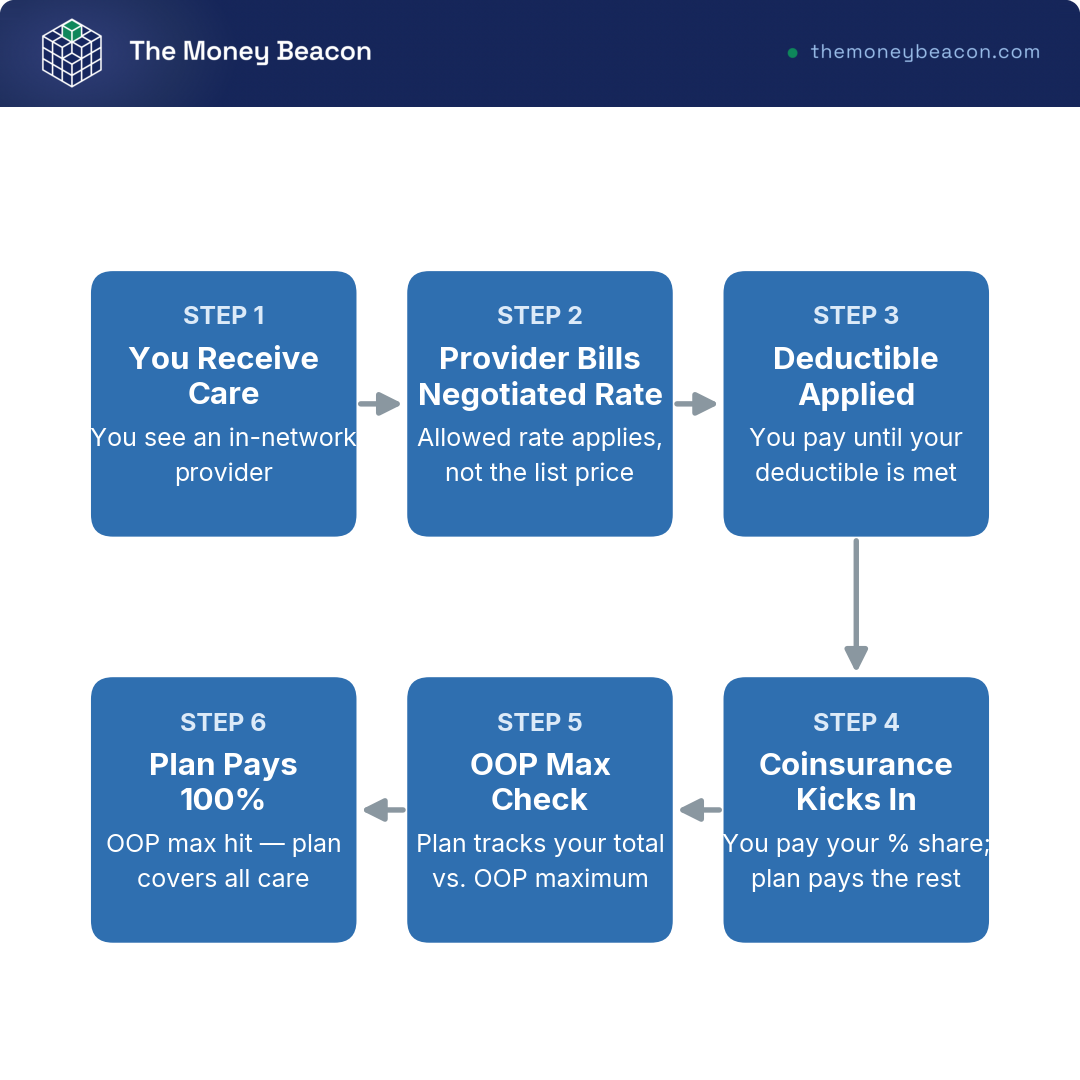
That single claim is the whole machine in miniature. Now run it across a year of real care, and the abstract levers turn into a number you can budget around.
1.3 How the Pieces Interact: A Year of Care in Real Dollars
A single claim shows the mechanics, but a hard year shows the stakes. Take an illustrative in-network plan: premium $400 a month, deductible $2,000, coinsurance 20%, out-of-pocket maximum $8,000. Now suppose you need a $30,000 surgery on top of $1,000 of routine care. What does that year actually cost you?
The premiums are the easy part: $400 times twelve is $4,800, paid no matter what, and they sit outside everything else. The first $2,000 of your bills goes to meeting the deductible. After that, coinsurance applies at 20% on the remaining charges, which would run to about $5,800, except it never gets that far, because your cost-sharing is capped. Once your running total reaches the $8,000 out-of-pocket maximum, the plan pays 100% for the rest of the year.
| Step | Calculation | Your cost | Running OOP total |
|---|---|---|---|
| Premiums | $400 x 12 | $4,800 (separate) | n/a |
| Meet deductible | First $2,000 of bills | $2,000 | $2,000 |
| Coinsurance 20% on next bills | 20% of remaining ~$29,000 = $5,800, capped | $6,000 | $8,000 (OOP max hit) |
| Rest of year | Plan pays 100% in-network | $0 | $8,000 |
| Total cost of care | Deductible + coinsurance, capped at OOP max | $8,000 | $8,000 |
| Total annual cost | Premiums + OOP | $12,800 | n/a |
Illustrative figures, not provider-specific; data current as of June 2026.
So your cost of care lands at $8,000 and your total annual cost at $12,800. That second figure, premiums plus out-of-pocket, is the number that decides a plan, and it is the one this guide keeps returning to. The mix shifts with how much care you use: in a high-cost year like this one the out-of-pocket maximum matters far more than the deductible, because it caps your worst case, while in a near-zero year the premium dominates and the deductible barely registers. Before any of this math even starts, it helps to keep cash set aside to absorb a bad year, the kind of buffer you can park in a high-yield savings account so the deductible never catches you short.
1.4 Networks: HMO, PPO, EPO, and POS, and Why In-Network Matters
The dollar math assumes you stay in-network, and that assumption is doing heavy lifting. The network is the set of doctors and hospitals your plan has contracted with, and the plan type tells you how strict those boundaries are and what it costs to cross them.
| Network type | Need referral for specialists? | Out-of-network coverage? | Primary care physician required? | Typical relative premium |
|---|---|---|---|---|
| HMO | Usually yes | Emergencies only | Usually yes | Lower |
| EPO | Usually no | Emergencies only | Often no | Lower to mid |
| POS | Usually yes | Yes, at higher cost | Usually yes | Mid |
| PPO | No | Yes, at higher cost | No | Higher |
General structure; specifics vary by insurer and plan. Data current as of June 2026.
The pattern runs from tight to loose. An HMO usually makes you pick a primary care physician and get a referral before seeing a specialist, and it covers out-of-network care only in emergencies, which is part of why its premium runs lower. An EPO is similar on the out-of-network rule but often skips the referral and the primary care requirement. A POS plan asks for referrals yet will pay something out-of-network at a higher cost, and a PPO health plan drops the referrals entirely and covers out-of-network care, which is why it usually carries the highest premium. The looser the leash, the more you pay each month.
Step outside the network and you meet balance billing: an out-of-network provider can bill you the gap between their charge and what your plan allows, on top of your normal cost-sharing. The federal No Surprises Act, effective January 1, 2022, blocks these surprise bills for most emergency services, for out-of-network providers working at in-network facilities, and for air ambulances. Those protections are real, but they do not cover every situation, so the network list still deserves a close look.
Tom’s take

I’ve shopped most of the big private banks and made them compete, and the same instinct pays off with a health plan: before I commit, I pull up the actual network list and check that the doctors and hospital I actually use are on it. The premium tells you almost nothing until you know who is in and who is out.
The network sets the price of access, but it also raises a sorting question: which dollars you spend actually move you toward those ceilings, and which quietly do nothing?
1.5 What Counts Toward Your Deductible and Out-of-Pocket Max
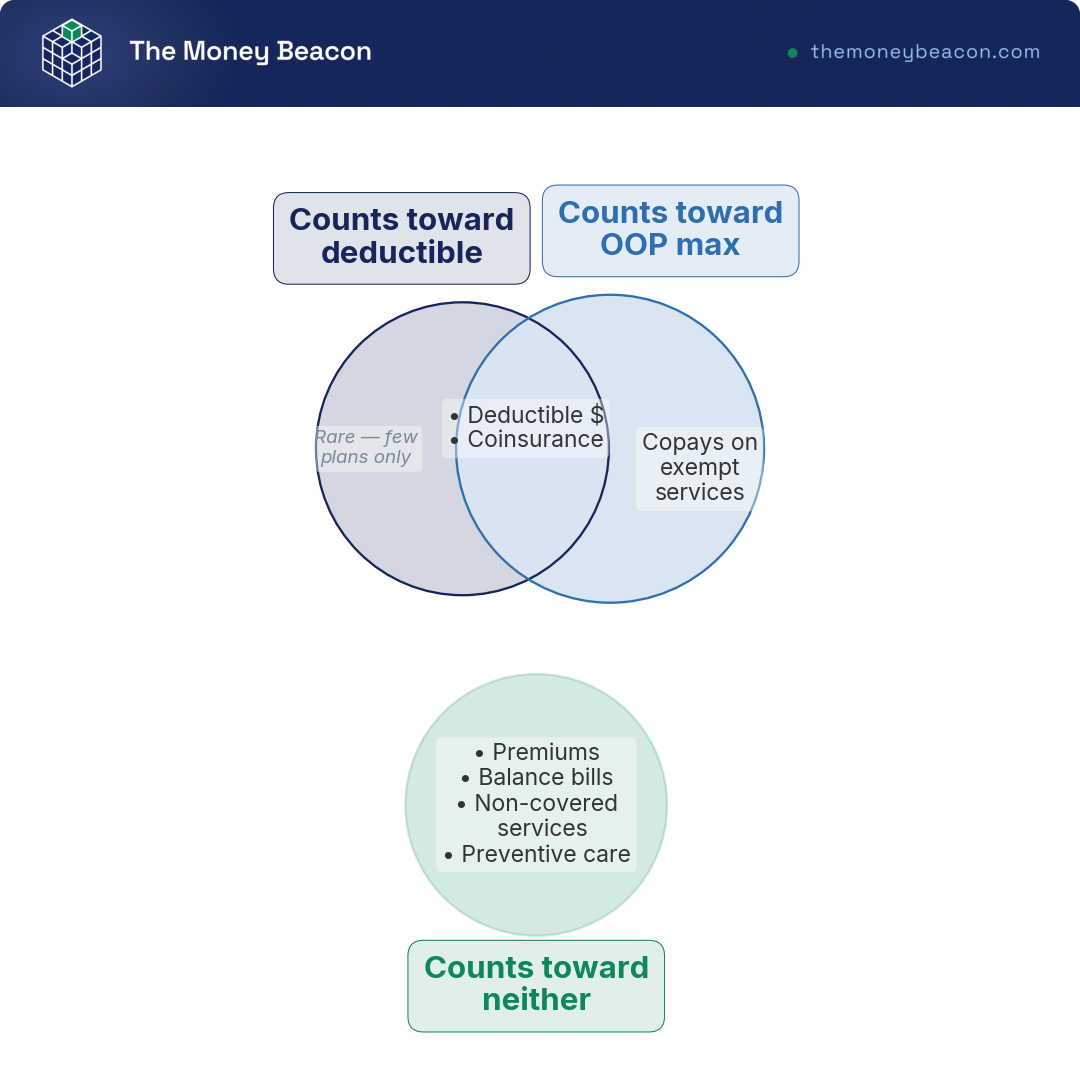
You now have all five levers and you have watched a claim move through them, which means we can settle the two confusions that cost people the most. Understanding how medical insurance works comes down to sorting your spending into three buckets.
Most in-network deductible spending and your post-deductible coinsurance count toward both the deductible and the out-of-pocket maximum, so those dollars do double duty pushing you toward relief. Copays on services that are exempt from the deductible count toward the out-of-pocket maximum but not necessarily the deductible. And a third bucket counts toward neither: your premiums, balance bills, non-covered services, and out-of-network charges, all of which sit entirely outside the ceilings.
Here is the second confusion worth clarifying. ACA-compliant plans cover a defined list of preventive services at $0 in-network, even before you have touched your deductible, and that free preventive care does not reduce your deductible. The annual physical is genuinely free, but it does not move you one dollar closer to the point where the plan starts sharing your other costs. Pair that with the premium rule from earlier and you have the two facts most people get backward.
With the mechanics of a single plan clear, the obvious question is where you actually get one of these plans in the first place, and which path fits your life.
2. The Main Ways Americans Get Covered
You can read a plan summary now and run the total-cost math on it. But knowing how a plan works does not tell you where to get one, and the right door depends entirely on your job, your income, and your age. We start with job-based coverage because it fits the most people, move to the Marketplace and the public programs by who they serve, and finish with short-term plans so you can spot when the cheap option is a genuine trap.
2.1 Employer-Sponsored Plans and the W-2 Employee’s Decision
For most working Americans the decision is already half made, because employer-sponsored health insurance is the largest source of private coverage in the country, covering roughly 60% of the non-elderly population. Your employer picks the plans, pays a large share of the premium, and deducts your portion pre-tax under what is called a Section 125 cafeteria plan, which lowers your taxable income before you have done anything clever.
So how large is the employer’s share? Per the 2025 KFF Employer Health Benefits Survey, employers pay on average about 84% of the premium for single coverage and about 74% for family coverage, leaving you with roughly 16% and 26% respectively. That subsidy is the reason a job-based plan is usually hard to beat on price.
| Path | Who it fits | Premium support | Pre-existing conditions covered? | Main risk |
|---|---|---|---|---|
| Employer (ESI) | W-2 employees | Employer subsidy + pre-tax | Yes | Limited plan choice |
| ACA Marketplace | Self-employed, between jobs, no ESI | Income-based PTC/CSR | Yes | Subsidy reconciliation |
| Medicaid/CHIP | Low income | Free or near-free | Yes | Coverage gap in non-expansion states |
| Short-term (STLDI) | Brief gap, healthy | None | No (can deny/exclude) | No essential benefits |
| COBRA | Recently left a job | None (you pay full premium) | Yes | Very expensive |
General comparison; data current as of June 2026.
The catch for a W-2 employee runs in two directions. Your plan choice is limited to whatever the employer offers, and an affordable offer generally locks you out of Marketplace subsidies. An offer counts as affordable if your share for self-only coverage is at or below 9.96% of household income for 2026, and if it clears that bar you usually cannot claim a premium tax credit elsewhere. The one relief valve is the family-glitch fix, effective December 12, 2022, which lets your dependents qualify for Marketplace help when the family coverage your employer offers is unaffordable, even if your own self-only coverage is not. Lose the job entirely and COBRA can keep the same plan going as a bridge, but you pay the full premium plus up to a 2% fee, which works out to as much as 102% of the cost of coverage. Worth knowing too: those pre-tax payroll deductions are one of the simpler ways to lower your taxable income legally without touching your investment plan.
2.2 The ACA Marketplace and Which Path Applies to You
So what if you are self-employed, between jobs, or your employer offers nothing? That is what the ACA Marketplace is for, and it plays by friendlier rules. Every Marketplace plan is guaranteed issue, meaning no medical underwriting and no power to turn you away, and none of them can exclude a pre-existing condition. Each must also cover the ten essential health benefits, including ambulatory care, emergency services, hospitalization, maternity and newborn care, mental health and substance-use treatment, prescription drugs, rehabilitative services, lab work, preventive care, and pediatric care.
The process itself is straightforward. You create an account on HealthCare.gov or your state exchange, enter your household size and estimated annual income (your modified adjusted gross income, or MAGI), and get an eligibility result for a premium tax credit, cost-sharing reductions, or Medicaid. From there you compare plans by total annual cost, the same number from earlier. Where you sign up depends on your state: for 2026 there are 21 state-based exchanges, three of which run on the federal platform, with names like Covered California, NY State of Health, and Pennie, while everyone else uses HealthCare.gov during open enrollment.
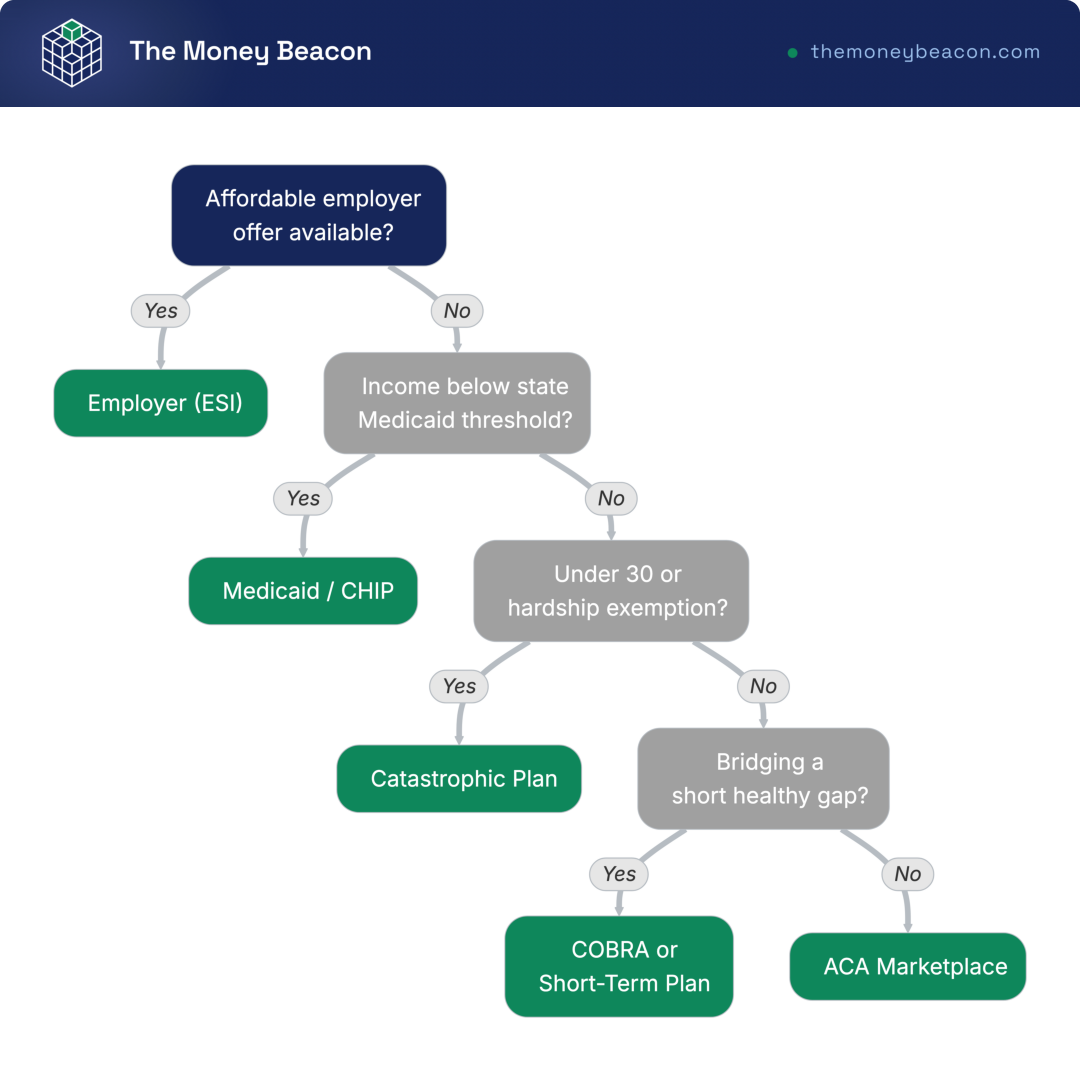
The decision tree above sorts you in a few questions. An affordable employer offer routes you to job-based coverage. Income below your state’s Medicaid threshold sends you to Medicaid or CHIP. Being under 30 or facing a hardship opens up a catastrophic plan. Bridging only a short, healthy gap points to COBRA or a short-term plan. For most people without one of those, the default leaf is the ACA Marketplace, which is the home base for the self-employed and between-jobs path the rest of this guide follows.
2.3 Medicaid, CHIP, and Medicare for the Low-Income Household
For lower-income households the routing turns on eligibility rather than plan shopping, because the public programs are sorted by income and age, not by tier trade-offs. Medicaid covers low-income adults up to 138% of the federal poverty level in states that expanded it. The complication is that about 10 states have not expanded as of 2026, which leaves some adults in a coverage gap: earning too much to qualify for Medicaid yet too little to land in the best subsidy structure.
CHIP, the Children’s Health Insurance Program, fills part of that space by covering children in families that earn above the Medicaid limit but below a state-set ceiling. Medicare is the reference point for the 65-and-older crowd, and it carries one wrinkle worth flagging early: enrolling in Medicare ends your eligibility to contribute to a health savings account, a point we come back to later. Medicare.gov advises stopping HSA contributions about six months before you apply, because Part A enrollment can be retroactive and quietly disqualify contributions you have already made. If retirement is on the horizon, this is one place where your health coverage and your retirement plan have to be coordinated rather than handled in separate piles.
2.4 Short-Term Plans: Why They Are Usually a Trap, and a Safety Self-Test
That leaves the cheap option you should screen last, once you know the legitimate paths. Short-term limited-duration insurance looks tempting on price for one reason: it is medically underwritten, which means it can deny you, exclude a pre-existing condition, and skip the essential health benefits entirely. It does not meet ACA standards, so it is not a substitute for real coverage. A 2024 federal rule, issued March 28, 2024 and effective September 1, 2024, limits new short-term plans to a 3-month initial term and 4 months total with a prominent warning label, though the departments have signaled they may revisit it.
So when does a short-term plan ever make sense? Only when you are bridging a brief, healthy gap with no ongoing care, where a low premium for a few weeks beats paying nothing and praying. The moment a chronic condition or an expected procedure enters the picture, it becomes the wrong product, because the very things you need covered are the things it is allowed to exclude. For a short gap, COBRA or a short-term plan can carry you to the next enrollment window.
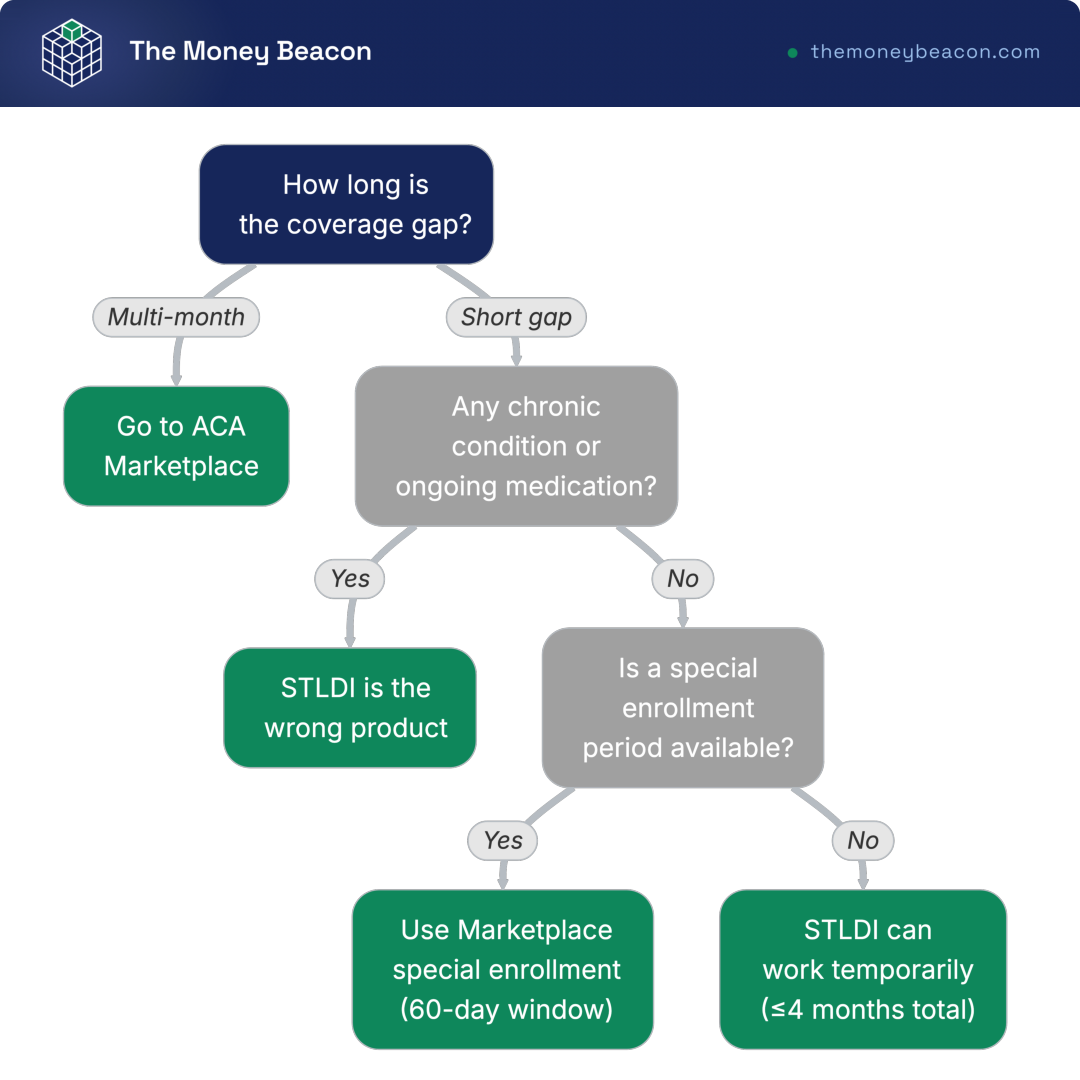
The self-test runs cleanly. A multi-month gap sends you to the Marketplace. Any chronic condition or ongoing medication marks short-term as the wrong product, full stop. An available special enrollment period routes you to Marketplace special enrollment instead. Only a short, healthy, no-ongoing-needs gap reaches the verdict that a short-term plan can work temporarily, and even then you should never lean on one if you have a condition that needs continuous care, because one excluded claim can undo years of premium savings in a single hospital stay.
Most readers, once they have ruled out a locked-in employer offer and the public programs, end up in the ACA Marketplace, where plans wear the labels Bronze, Silver, Gold, and Platinum. Those metal tiers are not just marketing colors, and what they actually trade off is where we go next.
3. The Metal Tiers and What They Trade Off
Bronze, Silver, Gold, and Platinum are not quality grades, and a Platinum plan is not “better” the way a Platinum credit card is. Each label stands for a number called actuarial value, and that number is the hinge the whole tier decision turns on. So which tier fits your expected usage and your income? We start from what actuarial value actually measures, climb from Bronze up to Platinum to find where a higher tier wins on total cost, and finish with the one reason Silver gets singled out for special treatment.
3.1 Actuarial Value: What the Metal Tiers Really Measure
Actuarial value (AV) is the share of total covered costs a plan pays on average across a standard population. So a Silver plan with a 70% AV is expected to cover about 70% of that population’s covered costs, which leaves the enrollees to pay about 30% between them through deductibles, copays, and coinsurance. The word “average” is doing the heavy lifting, because AV describes the split across a whole pool of people, not the bill any single one of them will get. You could buy a 70% Silver plan and pay nothing in a healthy year, or hit your out-of-pocket maximum in a bad one. The 70% is the plan’s design, not your forecast.
The metal labels map cleanly onto AV bands, and plans may drift slightly within a de minimis range, set at +2/-4 percentage points for 2026, with an expanded +5/-4 range for Bronze. The table below lines up all five tiers, including the catastrophic plan that sits below the metals.
| Tier | Target actuarial value | Plan pays (avg) | You pay (avg) | Best fit |
|---|---|---|---|---|
| Catastrophic | Below 60% (high deductible to OOP max) | Lowest | Highest until OOP max | Under-30 / hardship |
| Bronze | ~60% (58-62%) | ~60% | ~40% | Rare care, want low premium |
| Silver | ~70% (68-72%, higher with CSR) | ~70% | ~30% | Subsidy-eligible, moderate care |
| Gold | ~80% (78-82%) | ~80% | ~20% | Regular care |
| Platinum | ~90% (88-92%) | ~90% | ~10% | Heavy, predictable care |
Targets with de minimis variation; data current as of June 2026.
Read up the AV column and the trade is obvious. A richer tier shifts more of the average bill onto the plan, which you pay for through a higher premium every month. Whatever the tier, your worst case is still bounded by the 2026 federal out-of-pocket cap of $10,600 self-only and $21,200 family, the hard ceiling no metal plan can exceed. With the measure defined, it helps to see one tier’s split before we compare the tiers.
3.2 Seeing a Silver Plan’s 70% Split
Numbers on a page are easy to nod at and hard to feel. A Silver plan’s 70% is easier to hold onto when you can see the plan’s slice sitting next to yours.
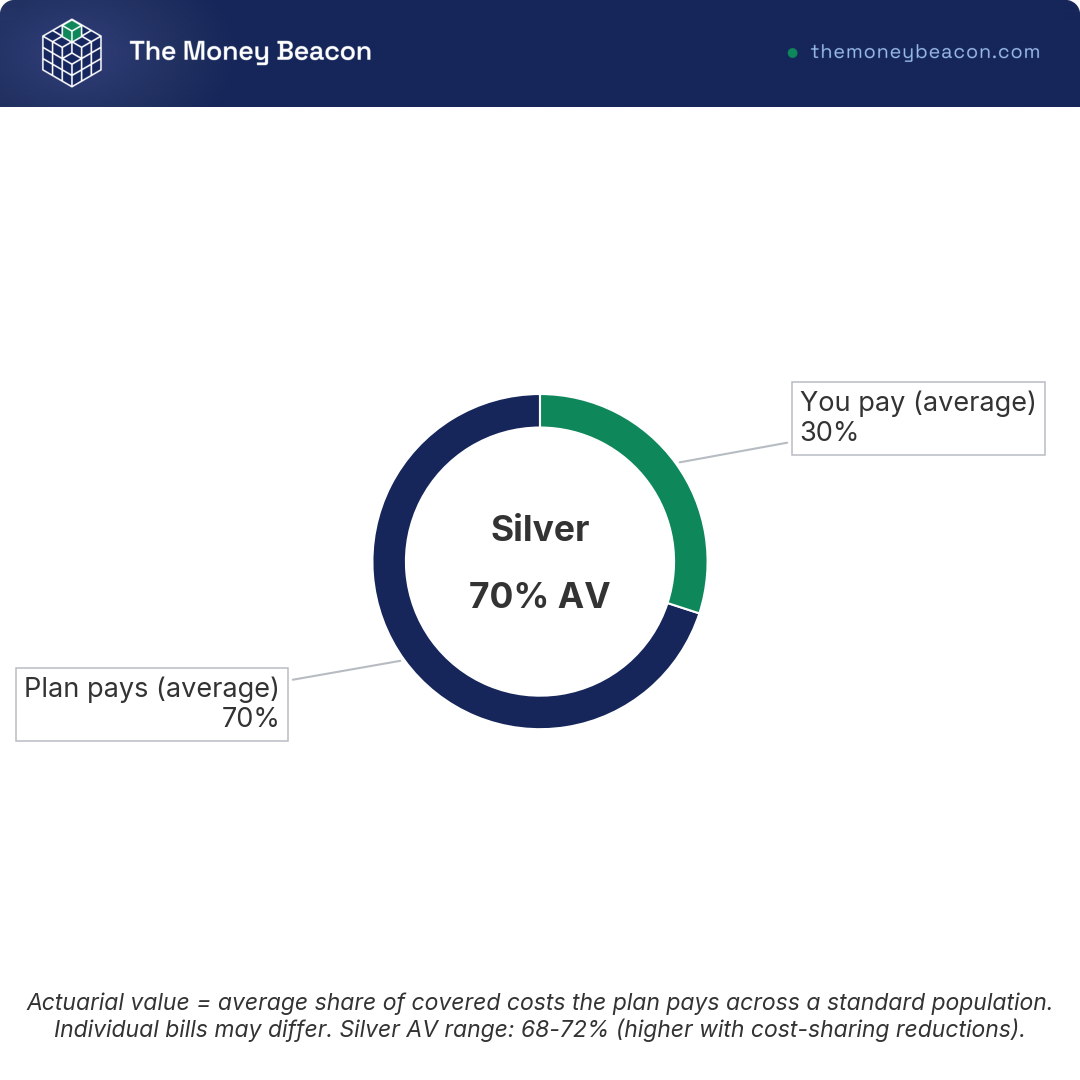
The plan covers roughly 70 cents of every covered dollar across the population, and the enrollees split the remaining 30 cents. Slide that whole picture toward the plan and you get Gold at about 80% and Platinum near 90%; slide it back toward the enrollee and you get Bronze around 60%, with catastrophic plans below that. Same chart, different angle, which is exactly how the tiers relate to each other.
3.3 From Bronze to Platinum: Where a Higher Tier Pays Off
So if a higher tier just moves the same money around, when is it worth paying more upfront? It depends entirely on how much care you expect to use. Bronze and catastrophic plans push the premium as low as it goes and the deductible as high as it goes, often all the way up to the legal out-of-pocket max. Catastrophic plans go a step further on price, but they are walled off: only enrollees under 30, or those 30 and older with a hardship or affordability exemption, can buy one, and you cannot use a premium tax credit to pay for it.
For everyone else, the logic comes down to your expected year of care. If you barely see a doctor, Bronze usually wins on total cost, because the premium you save dwarfs the deductible you never touch. Once your expected care climbs into the moderate-to-high range, Gold’s lower deductible and coinsurance often beat Bronze on total annual cost, because the extra premium buys back more than it costs in out-of-pocket spending. Platinum only pulls ahead with heavy, predictable utilization, the kind you can see coming on the calendar. The chart below plots total annual cost against expected medical spending for Bronze, Silver, and Gold, so you can read the exact crossover where a richer tier becomes the cheaper choice overall.
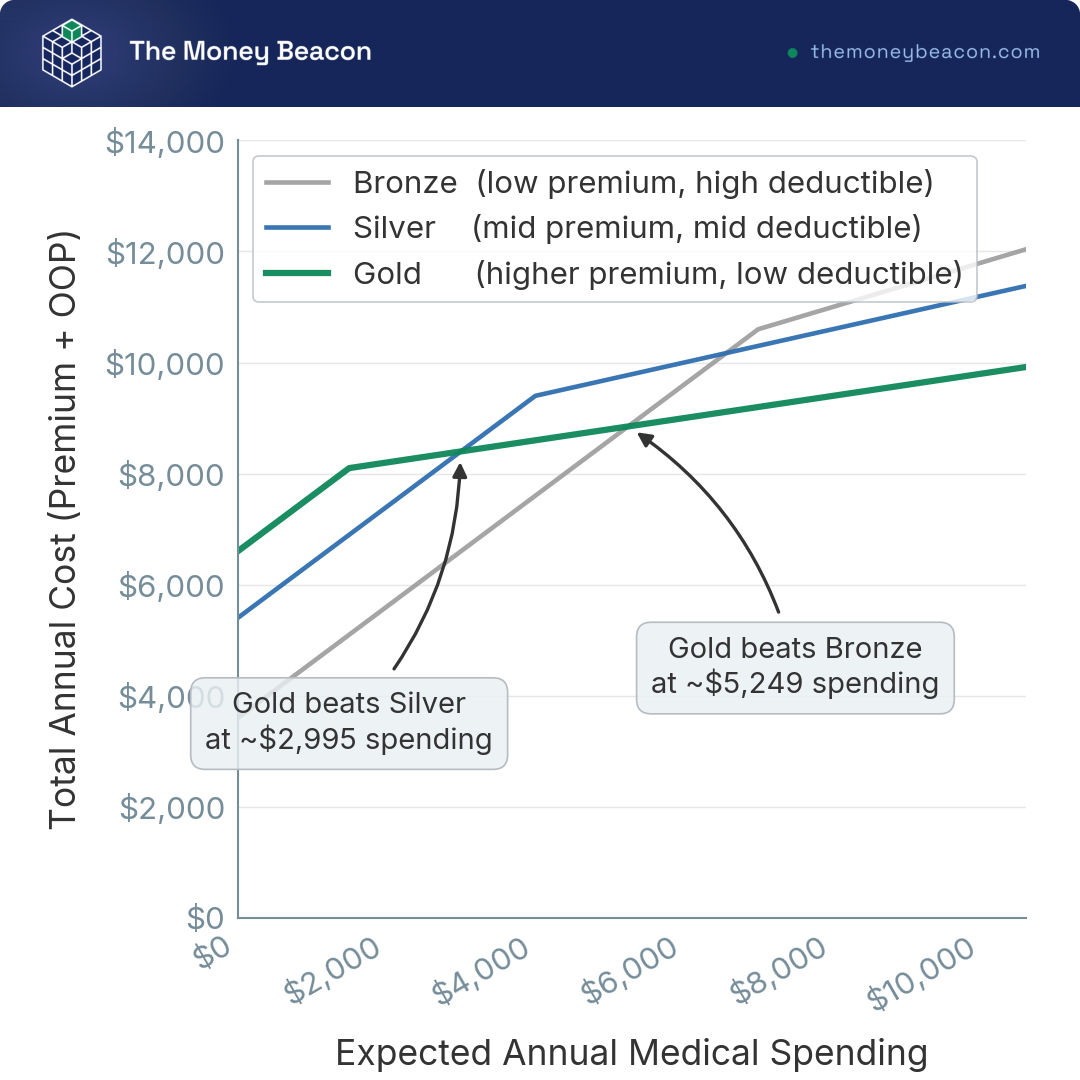
The lines cross because premium and out-of-pocket move in opposite directions as care rises. This is the same total annual cost we anchored on earlier, premium plus out-of-pocket, now plotted across a range of usage instead of a single year. Pick the tier whose line sits lowest at your honest estimate of care, not the one with the smallest premium. There is one tier, though, where the sticker AV understates what some buyers actually get, and that tier is Silver.
3.4 Why Silver Is Special: The Cost-Sharing Reduction Link
Silver looks like the safe middle child, and that reputation is half right and half a costly mistake. What sets Silver apart is that cost-sharing reductions (CSR) attach to Silver plans and nowhere else. For enrollees roughly between 100% and 250% of the federal poverty level, CSR quietly raises the effective actuarial value of a Silver plan well above 70%, shrinking the deductible, the copays, the coinsurance, and the out-of-pocket max, all at no extra premium. So a 70% Silver plan can behave like a Gold or even a Platinum plan for a qualifying buyer.
How rich that boost is depends on the income band, and the variants step down as income rises.
| Income band (% FPL) | CSR variant (effective AV) | Effect |
|---|---|---|
| 100% to 150% | ~94% AV (CSR 94) | Lowest deductible and OOP |
| 150% to 200% | ~87% AV (CSR 87) | Strong cost-sharing relief |
| 200% to 250% | ~73% AV (CSR 73) | Modest relief |
| Above 250% | Standard 70% Silver | No CSR |
CSR variants apply to Silver only; data current as of June 2026.
Below 250% of the poverty level, Silver is usually the clear play, because that hidden cost-sharing relief almost always outweighs any premium difference. Above 250% FPL, where CSR disappears, Silver loses its edge and can actually be the worst value on the board. Here is the wrinkle: insurers price the cost of unfunded CSR into Silver benchmark premiums, a practice called Silver loading that has continued in 2026 rate filings since federal CSR payments stopped in 2017. For a buyer who gets no CSR, that loading can leave Gold or Bronze cheaper than Silver after subsidies. So if your income clears 250%, compare Gold and Bronze directly rather than defaulting to Silver out of habit. Exactly how much you keep after the premium tax credit and CSR depends on where your income lands against the poverty level, which is its own decision we come to shortly. First, a specific high-deductible plan opens a door no other plan does.
4. HSA-Eligible HDHPs and the Triple Tax Advantage
A high deductible sounds like pure downside, the thing you spend the whole tier section trying to avoid. But one particular flavor of high-deductible plan unlocks the most tax-friendly account in the US code, and for the right person that account is worth more than the deductible costs. Which plans qualify, how big is the break in real dollars, and is it worth it for you? We start with what makes a plan eligible, put a dollar figure on the triple tax break, and end by setting the HSA against the use-it-or-lose-it FSA it is often confused with.
4.1 What Makes a Plan an HSA-Eligible HDHP
Not every plan with a big deductible opens a health savings account (HSA), and that catches people out. To qualify, a high-deductible health plan (HDHP) has to meet IRS minimum deductibles, stay under an IRS cap on the out-of-pocket maximum, and refrain from paying for most services before you have met the deductible, with preventive care as the main exception. The plan also has to be labeled HSA-eligible, and if the brochure does not say so, assume it is not. The 2026 parameters set all four numbers.
| Parameter | Self-only | Family |
|---|---|---|
| HDHP minimum deductible | $1,700 | $3,400 |
| HDHP maximum OOP (HSA rules) | $8,500 | $17,000 |
| HSA contribution limit | $4,400 | $8,750 |
| HSA catch-up (age 55+) | +$1,000 | +$1,000 |
2026 IRS figures (Rev. Proc. 2025-19); data current as of June 2026.
One pairing in that table trips up even careful shoppers. The $8,500 self-only and $17,000 family out-of-pocket cap is the HSA-eligibility ceiling under IRS rules, and it is a separate, lower number than the ACA federal OOP cap of $10,600 / $21,200. A plan can sit under the ACA ceiling and still blow past the tighter HSA limit, which would disqualify the account, so the two are not interchangeable. One more rule guards family plans: a family HDHP’s embedded individual deductible cannot drop below the $3,400 family minimum for 2026, or the plan loses HSA eligibility. Meeting the plan rules is only half the test, though, because your own situation can disqualify you even when the plan qualifies.
4.2 Are You Eligible to Contribute to an HSA?
The plan can be perfect and you can still be locked out, usually by coverage you did not think of as a problem. The tree below runs the checks in order.
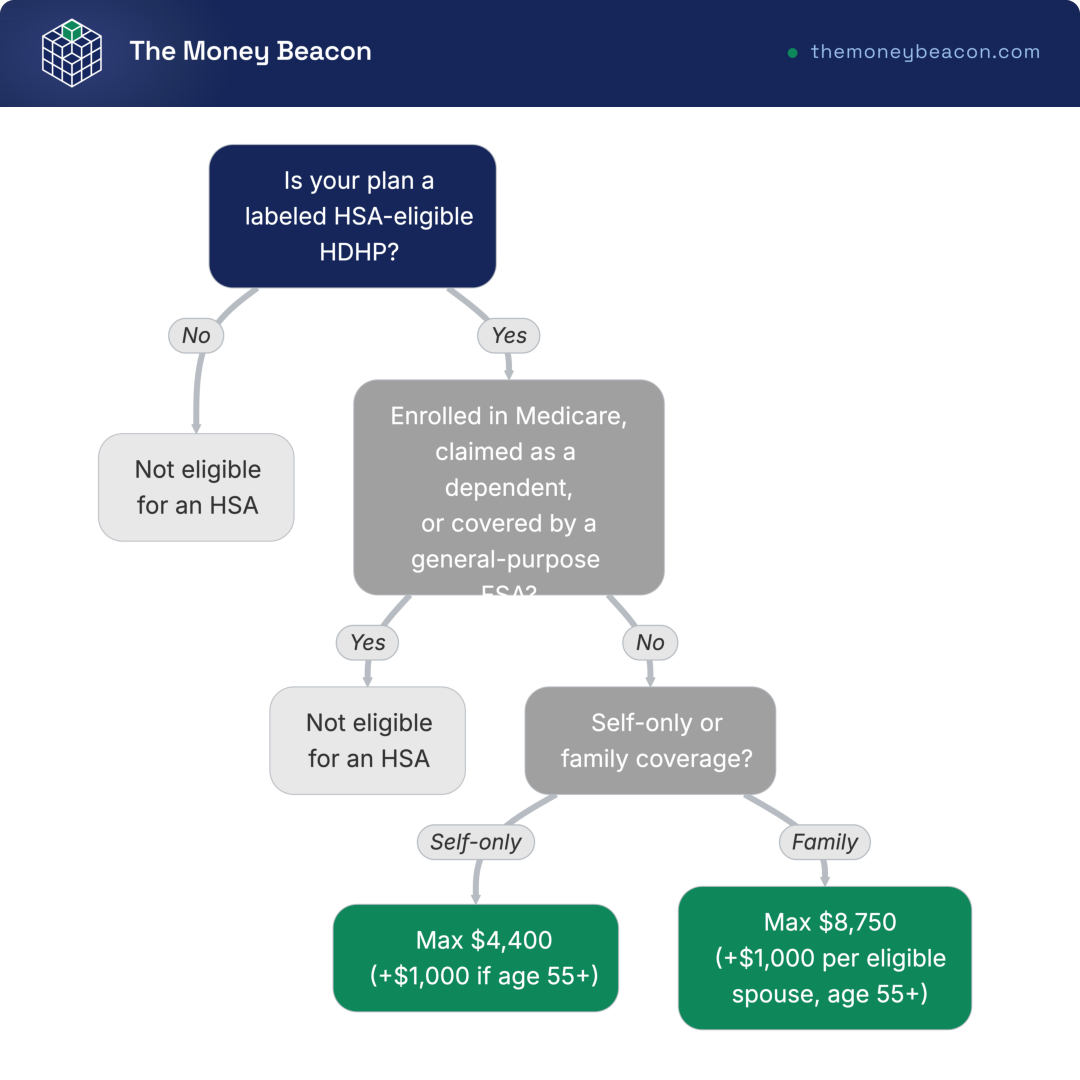
Start with the plan: if it is not a labeled HSA-eligible HDHP, you stop here. Then check for disqualifying coverage, because enrolling in Medicare, being claimed as a dependent, or carrying a general-purpose FSA (including your spouse’s) each silently knocks you out. That FSA trap is the one people miss most, so know the line: a general-purpose FSA disqualifies you, but a limited-purpose FSA for dental and vision is compatible and so is a spouse’s separate family HDHP. Clear those gates and your maximum is $4,400 self-only or $8,750 for family coverage, plus $1,000 if you are 55 or older, with each spouse’s catch-up going into their own HSA. Once you know you can contribute, the real reason to bother shows up in the tax math.
4.3 The Triple Tax Advantage and the Long-Game Strategy, in Dollars
The HSA earns its reputation because it is the only US account that gives you three tax breaks at once. Your contributions go in pre-tax or as an above-the-line deduction, the money grows tax-free, and qualified medical withdrawals come out tax-free. No 401(k), no Roth, no brokerage account stacks all three.
Let’s put a number on it. A saver in the 24% federal bracket who contributes the full $4,400 self-only saves about $1,056 in federal income tax that year, because $4,400 times 24% is $1,056. Run the contribution through an employer’s Section 125 cafeteria plan and you skip FICA (Social Security and Medicare) tax on it too, since those dollars are excluded from wages, so the saving climbs further. And that break repeats every year you contribute.
The long game is where the HSA stops being a spending account and turns into something else. The move is to max the HSA, pay your current medical bills out of pocket where you can afford to, keep every receipt, and let the balance compound untouched. Years later you reimburse yourself tax-free for those old bills, having let the money grow in the meantime. The chart below shows the 30-year gap between spending the HSA each year and investing it while paying bills out of pocket.
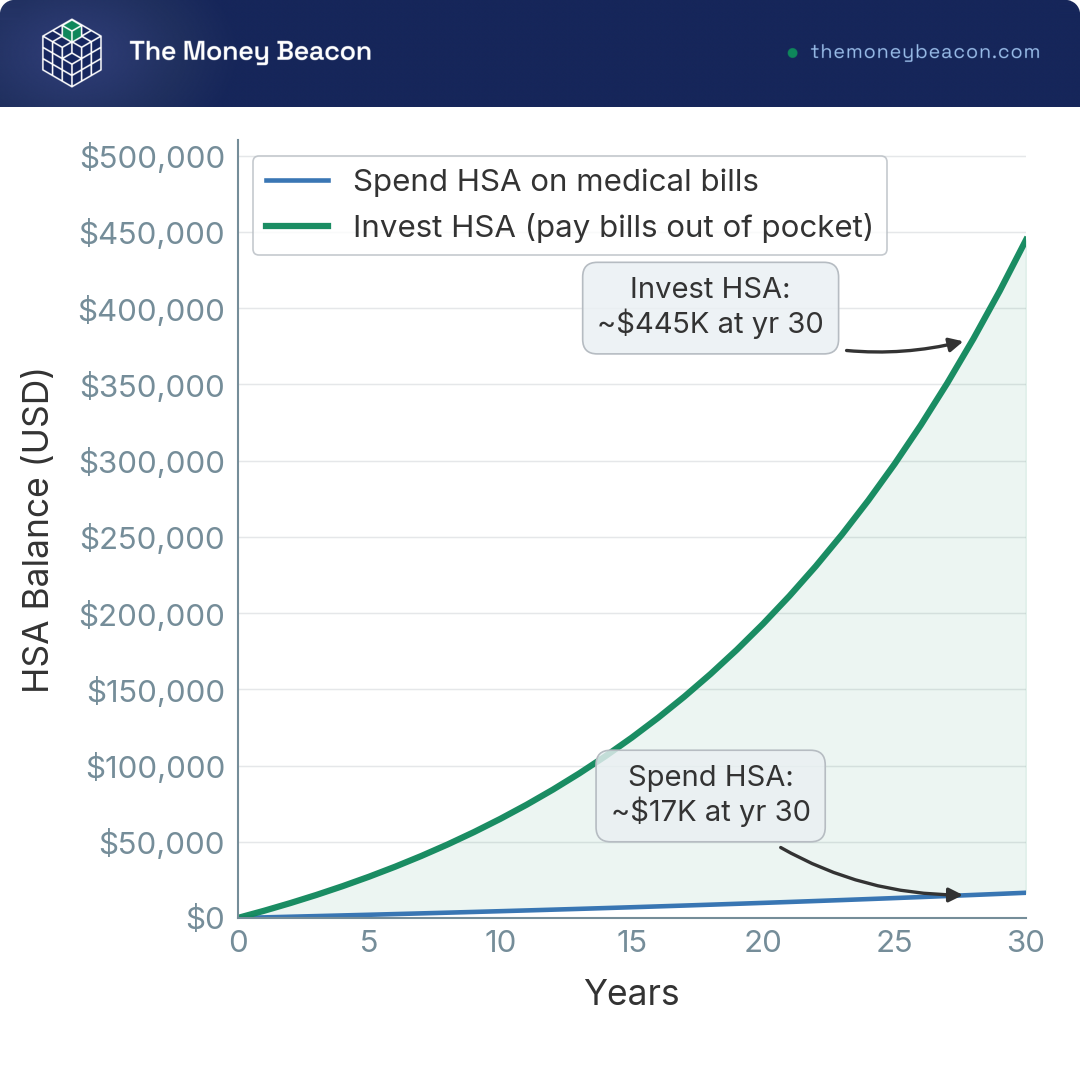
That gap only exists because of one distinction worth keeping straight: the HSA is the account, the wrapper, while the cash, money-market funds, or index funds you hold inside it are the asset classes. Investing the balance is what makes it grow, and you can do that with the same low-cost index funds and ETFs you would use anywhere else, once your custodian’s uninvested-cash threshold is met. After 65, the account stays generous: qualified medical withdrawals remain tax-free, and non-medical withdrawals are taxed as ordinary income with no 20% penalty, much like a traditional individual retirement account (IRA), except an HSA carries no required minimum distributions.
Hank’s take
the part most savers underestimate is how much an untouched, invested HSA quietly turns into a stealth retirement account. Leave it alone for a few decades and tax-free compounding does the work; what the data shows is that the people who win with an HSA are usually the ones who treat it least like a checking account.
Whether an HSA fits also depends on the account it gets compared with most, the FSA, which runs on completely different rules.
4.4 FSA vs HSA: Use-It-or-Lose-It and Who Each Fits
People throw “HSA” and “FSA” around as if they were the same account with different letters, and the differences are exactly where the money is won or lost. The table sets them side by side.
| Feature | HSA | Health FSA |
|---|---|---|
| Requires HDHP? | Yes | No |
| 2026 contribution limit | $4,400 / $8,750 | $3,400 (employer-set) |
| Funds roll over? | Yes, indefinitely | Limited carryover (up to $680 for 2026) or grace period |
| Portable if you leave job? | Yes | No |
| Can invest the balance? | Yes | No |
2026 figures; data current as of June 2026.
The split is clean once you see it. If you have an HSA-eligible HDHP, the HSA wins on every line that matters for the long game, because the money rolls over forever, follows you when you change jobs, and can be invested, while a limited-purpose FSA can ride alongside it for dental and vision. If you are on a traditional low-deductible plan instead, you cannot open an HSA at all, and a health FSA is the pre-tax option available to you, useful but bound by use-it-or-lose-it rules. That answers the common “can I have both?” question: a general-purpose FSA disqualifies your HSA, while a limited-purpose FSA does not. Picking the right tier and the right account still sits on top of one more question, what you actually pay after the Marketplace runs your income through its subsidy math, which is where we head next.
5. Premium Tax Credits and Cost-Sharing Reductions
You have a tentative tier, and you have decided whether an HSA makes sense for you. The one number still missing is the price you actually pay once the Marketplace runs your income through its subsidy math. So how much is health insurance after the help arrives, who qualifies for that help, and how do you avoid owing it back at tax time? We start with how the premium tax credit turns your income into a monthly price, add the cost-sharing reductions that cut what you pay at the doctor, map who clears the income bands and the returning cliff, and finish with the reconciliation trap that catches people in April.
5.1 The Premium Tax Credit: How Income Sets Your Real Cost
The premium tax credit (PTC) flips the usual logic of insurance pricing. Instead of the plan setting a premium and you paying it, the credit caps what your household pays for a reference plan at a set percentage of your income, then covers the rest. That reference is the benchmark plan, the second-lowest-cost Silver plan in your area, and the credit equals its premium minus your capped contribution. You can then spend that credit on any metal tier you like, not just the benchmark Silver.
The percentage you pay scales with your income against the federal poverty level (FPL). Under the enhanced schedule that ran through 2025, a household at the bottom paid 0% and the cap topped out at 8.5%, with no upper limit on who could qualify.
| Household income (% FPL) | Capped premium as % of income | Post-subsidy benchmark cost |
|---|---|---|
| Up to 150% | 0% | $0 |
| 200% | ~2% | Low |
| 300% | ~4% to 6% | Moderate |
| 400% | 8.5% (cap) | 8.5% of income |
| Above 400% | 8.5% (enhanced) or no credit (pre-2021 cliff) | Depends on 2026 policy |
Enhanced-schedule basis; 2026 applicability is policy-dependent. Data current as of June 2026.
Here is the part you cannot skip. The enhanced ARPA and IRA schedule that produced those generous percentages expired at the end of 2025. Under current law, the pre-2021 structure returns for 2026, with a sliding scale that rises to roughly 9.5% and a hard eligibility cliff at 400% FPL, unless Congress extends the enhancements. As of June 2026 that remains an open policy question, so read the table above as the mechanics of how the credit works, not a guarantee of the exact percentage you will see at enrollment.
5.2 What You Pay by Income, and Cost-Sharing Reductions on Silver
So what does the credit actually leave on your monthly bill? The chart plots the post-subsidy benchmark Silver premium at four income levels, and the shape tells the story better than any single figure.
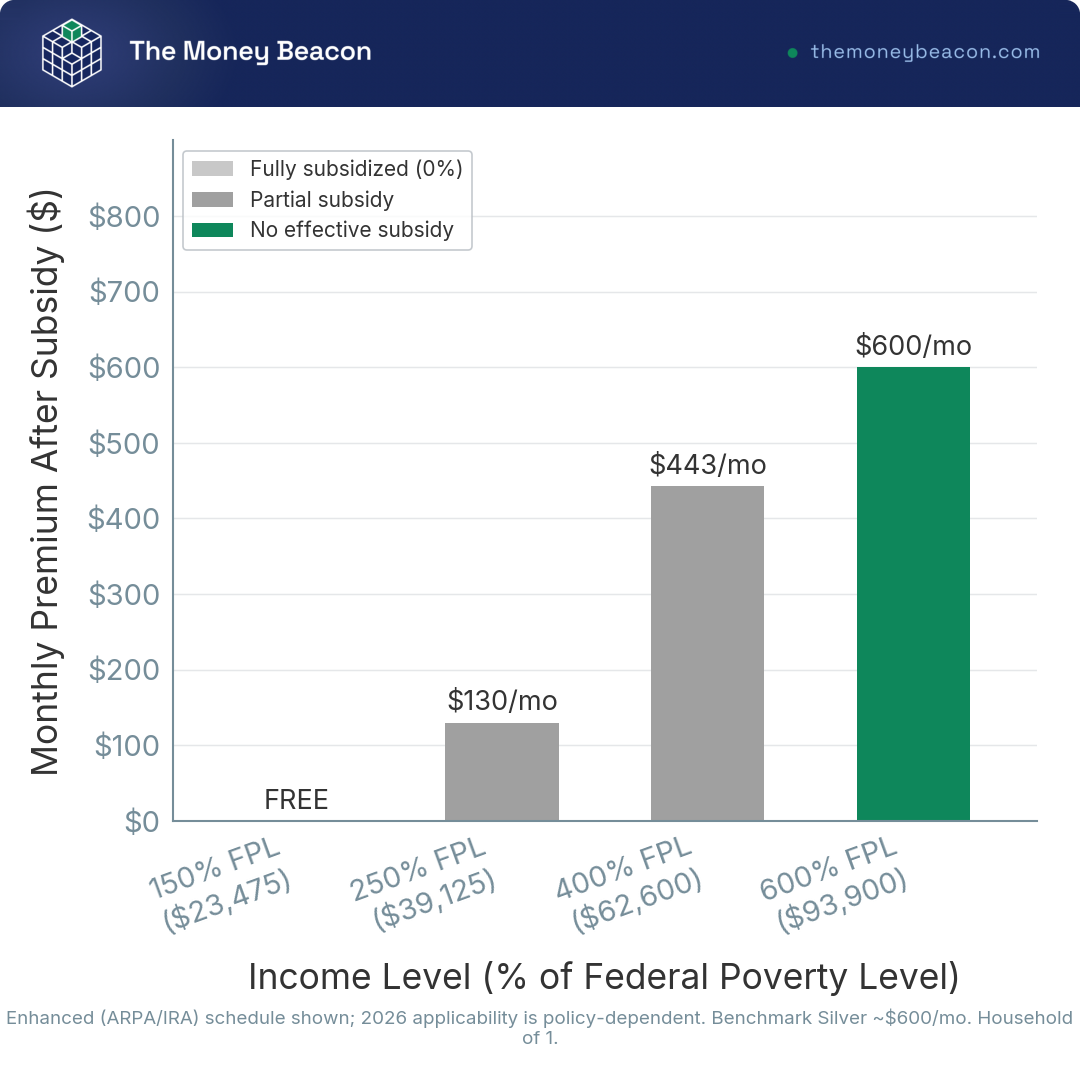
The bars climb as income rises, because a higher income means a higher capped contribution and a thinner credit. The tallest bar reflects where the help can stop entirely under the returning 400% FPL cliff. To anchor the dollars for a household of one, 100% FPL is $15,650 a year and 400% FPL is $62,600, with Alaska and Hawaii working off higher tables. Cross that 400% line under current law and your premium is no longer capped at a share of income, so the jump can be steep.
The credit is only half the subsidy story. Cost-sharing reductions (CSR) attach to Silver plans for buyers roughly between 100% and 250% FPL, and they cut the deductible, the copays, the coinsurance, and the out-of-pocket max, the way we saw in the 94, 87, and 73 percent variants earlier. This distinction is worth holding onto: the premium tax credit lowers what you pay each month, while cost-sharing reductions lower what you pay at the point of care. They stack for an eligible Silver enrollee, which is exactly why, below 250% FPL, Silver usually wins. The richer cost-sharing almost always outweighs any premium gap with a cheaper Bronze plan.
5.3 Who Qualifies: Income Bands, Household Size, and the Cliff
Whether any of this reaches you turns on two inputs: your modified adjusted gross income (MAGI) and your household size, measured against the poverty level. One timing quirk trips people up. Marketplace eligibility for 2026 coverage uses the 2025 HHS poverty guidelines, because the Marketplace always applies the prior year’s table, so the figures below are the ones your 2026 enrollment is actually scored against.
| Household size | 100% FPL | 138% FPL (Medicaid expansion) | 400% FPL |
|---|---|---|---|
| 1 | $15,650 | $21,597 | $62,600 |
| 2 | $21,150 | $29,187 | $84,600 |
| 3 | $26,650 | $36,777 | $106,600 |
| 4 | $32,150 | $44,367 | $128,600 |
FPL guidelines applied to 2026 coverage (2025 HHS table); data current as of June 2026.
Read across your household-size row and you can place your own income in a band. The 138% column is the Medicaid line in expansion states, and the 400% column is the one that now carries real weight again. Under the pre-2021 rules, a single dollar of income above 400% FPL forfeits the entire premium tax credit, the cliff that defined Marketplace planning before 2021. The enhanced rules erased that edge through 2025, but with the enhancements lapsed, current IRS guidance puts the 400% FPL cliff back in force for 2026 unless Congress extends the credits. For a household of one, that means a year of MAGI at $62,599 can be subsidized while $62,601 is not, a swing worth thousands. Alaska and Hawaii read off their own higher FPL tables.
5.4 Advance Credits and the Reconciliation Trap at Tax Time
Most people do not wait until they file to use the credit; they take it in advance. The advance premium tax credit (APTC) is paid straight to the insurer each month to lower your premium, and the catch is that it runs on a number you estimate in the fall, your expected income, before the year has actually happened. The flowchart walks the full loop from that estimate to the settling-up at tax time.
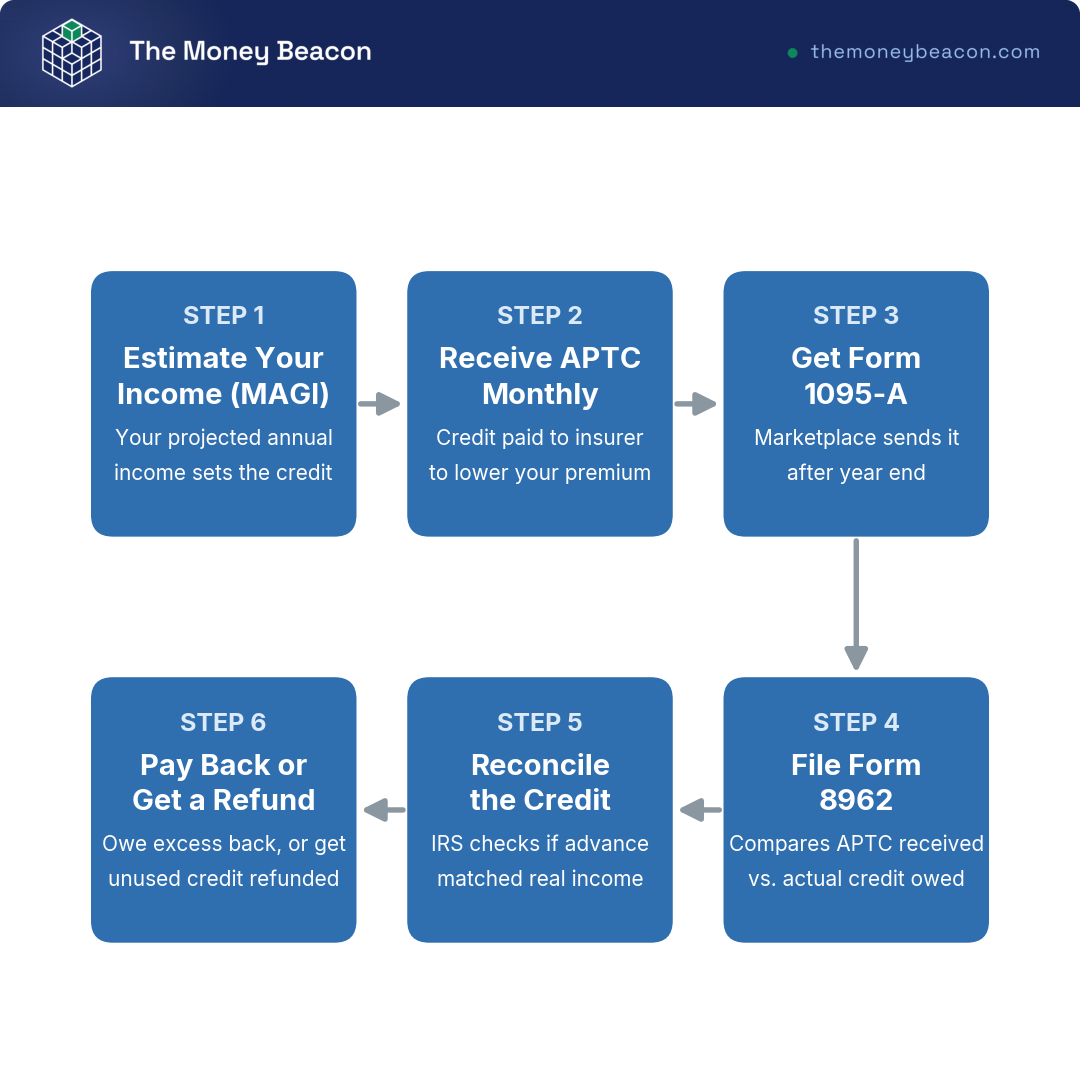
When you file, Form 8962 reconciles the advance credit you received against the credit your actual income earned, using the Form 1095-A your Marketplace sends. Estimate too low, your real income lands higher, and you repay the excess advance credit. How much you repay depends on income. Under the tax-year-2025 caps, repayment was limited on a sliding scale below 400% FPL, from $375 for a single filer under 200% FPL up to $1,625 in the 300-to-400% band (double those for married filing jointly), with no cap at all once you reach 400% FPL. For tax years after 2025, those caps fall away as the enhanced rules lapse, so a household above 400% FPL repays the full excess, no ceiling.
The defensive move is simple, and it costs you almost nothing. If your income is uncertain or might rise, a strong freelance year, a mid-year raise, a capital gain, take less APTC than the maximum the Marketplace offers. You carry a slightly higher monthly premium during the year, but you sidestep the repayment shock in April, and any credit you did not use comes back to you as a refund when you file. The mechanics here connect to the rest of your return, since the same MAGI that scores your subsidy also drives how your investment income is taxed, so a big gain can move both at once.
Tom’s take
I optimize every money decision across the tax angle as much as the financial one, and this is a place that rewards it. When my income for a year is genuinely hard to call, I would rather estimate it on the high side and take less credit up front than hand myself a surprise bill at filing. The refund for unused credit shows up either way, so the conservative estimate costs you nothing but a little monthly cash flow.
With the subsidy math settled, all the cards are finally on the table: levers, paths, tiers, accounts, and credits. What remains is to put them in order, and run them as one repeatable process the next time you enroll.
6. A Step-by-Step Framework for Choosing Your Plan
Everything up to here has been understanding and evaluating. Now we act. How do you fold the levers, the coverage paths, the tiers, the HSA question, and the subsidy rules into one process you can run in an afternoon and trust? We move through five steps, estimating your year of care, comparing on total cost, checking your subsidy, verifying your providers, and timing the enrollment window, then collapse the whole thing into a single picture and a one-glance table.
6.1 Steps 1 to 3: Estimate Your Care, Compare Total Cost, and Check Your Subsidy
Step one is to estimate your expected year of care before you look at a single plan. Write down your routine visits, your recurring prescriptions, any procedure you already know is coming, and one honest worst-case scenario. The mistake here is guessing zero usage and ignoring the worst case, because the out-of-pocket maximum only earns its keep in the bad year you would rather not picture.
Step two is the comparison that decides everything, and it is the total-cost math we built back in section 1. For each candidate plan, add the annual premium to your expected out-of-pocket spending, and treat the out-of-pocket maximum as the ceiling on the worst case. Compare plans on total annual cost, not on the premium alone, because the lowest premium rarely wins once you add the care you actually expect to use. The classic error is comparing premiums side by side and forgetting that premiums never count toward the out-of-pocket max, so a cheap-premium, high-deductible plan can cost more in a year of real care. The crossover chart from section 3 shows exactly where a richer tier overtakes a cheaper one.
Step three checks your subsidy and tells you whether Silver wins. Estimate your MAGI, place it against the FPL bands from the table above, and let the 250% line make the call. Below 250% FPL, prioritize a Silver plan to capture the cost-sharing reductions, because that hidden relief usually beats any premium you would save elsewhere. Above 250% FPL, where CSR drops off, compare Gold and Bronze directly rather than defaulting to Silver, because Silver loading can leave it overpriced after subsidies. That single threshold turns the whole tier-and-subsidy question into one clean check.
6.2 Steps 4 and 5: Verify Your Providers, Decide on an HSA, and Hit the Right Window
Step four is the one people skip and regret. Before you commit, verify that each doctor and hospital you actually use is in-network for the specific plan, and that your prescriptions sit on the formulary at an affordable tier. The mistake is assuming coverage and finding out later, because an out-of-network provider can hand you a balance bill on top of your normal cost-sharing, exactly the gap the network rules in section 1 warned about. Five minutes on the plan’s provider lookup beats a surprise four-figure bill.
Step five decides the account and the timing. If an HSA-eligible HDHP fits your expected usage and your tax goals, plan to fund the HSA up to the 2026 limit, confirm you carry no disqualifying coverage like a general-purpose FSA or Medicare, and then enroll in the right window. The common errors are contributing while quietly disqualified and, worse, missing open enrollment and being locked out for a year. The timeline below marks every date that matters.
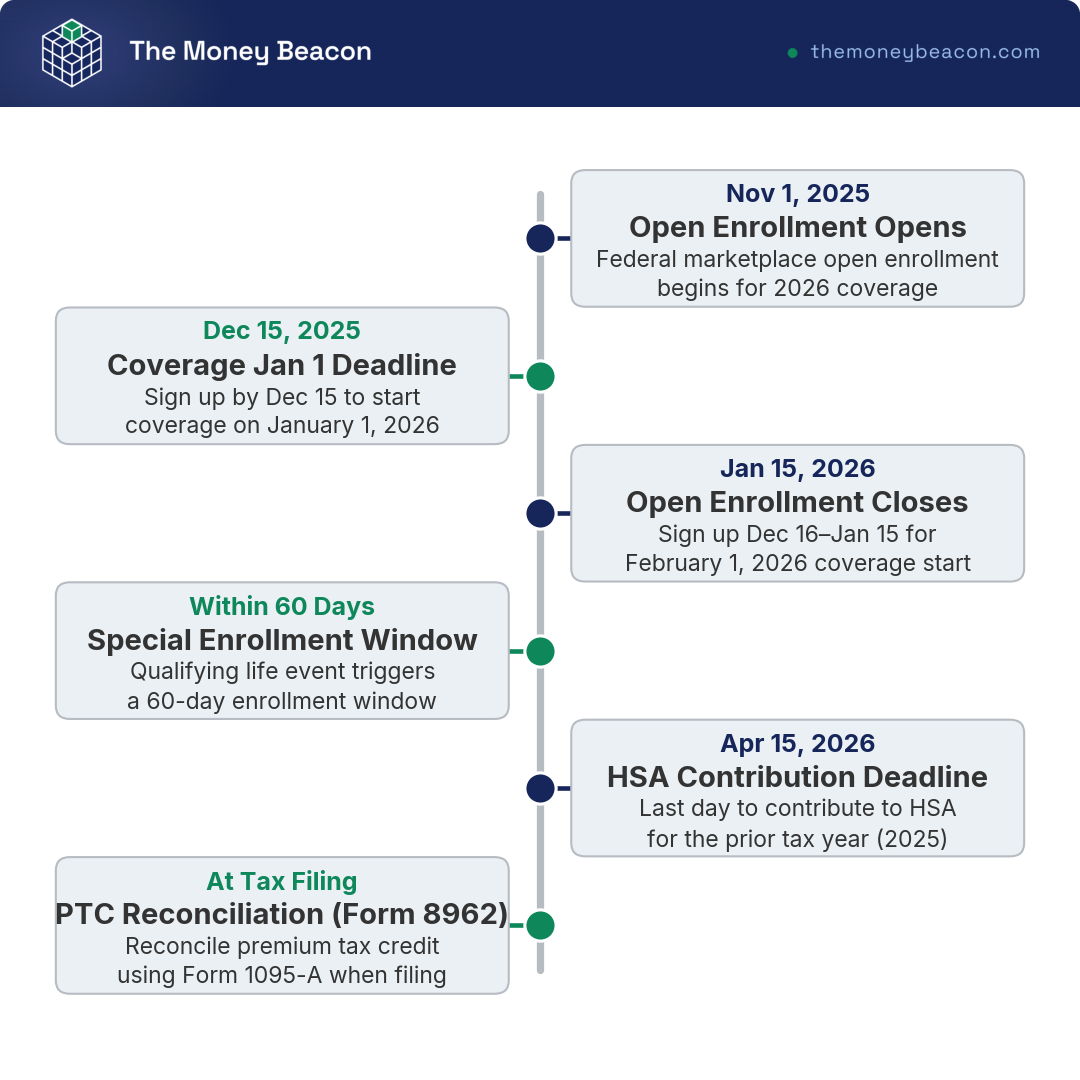
The federal calendar runs open enrollment from November 1, 2025 to January 15, 2026. Sign up by December 15, 2025 for coverage starting January 1, 2026, or between December 16 and January 15 for a February 1 start. Miss the window without a qualifying life event and you wait a year, though a qualifying event like marriage, a birth, or a job loss opens a 60-day special enrollment period. Two more dates close the loop: the April 15 deadline to make HSA contributions for the prior tax year, and Form 8962 reconciliation when you file. State exchanges set their own deadlines, with California running through January 31, 2026, for example. These enrollment and HSA-funding decisions sit right alongside your retirement plan, since an HSA you leave invested becomes one of its quietest pieces.
6.3 The Whole Framework in One Decision Tree
Five steps in sequence are easy to follow and easy to lose track of. The decision tree below combines the moving parts, your subsidy eligibility, your income against the 250% FPL line, your expected usage, and whether an HSA fits, into a single recommended tier-and-account pairing.
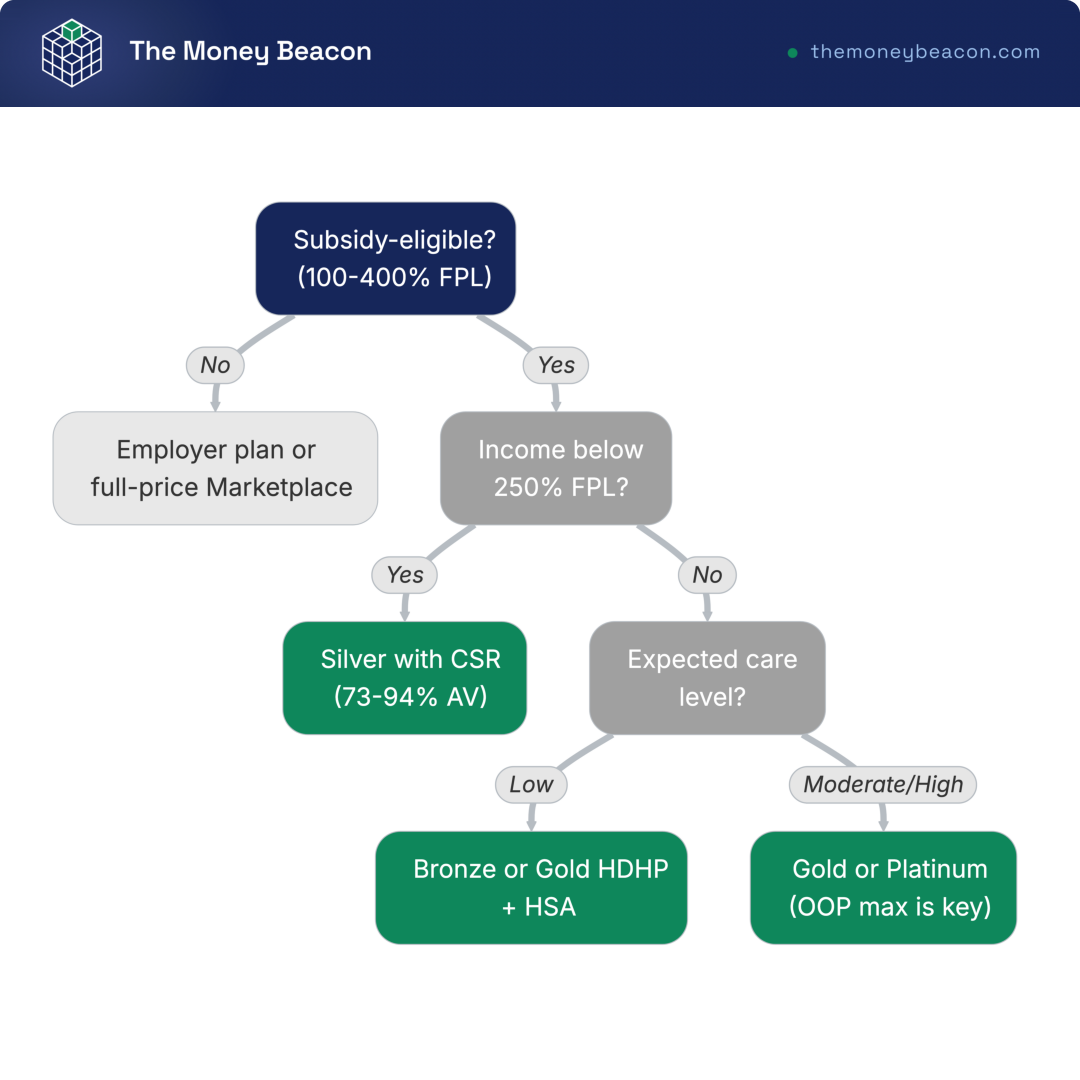
Trace your own branch and the recommendation falls out. Below 250% FPL with moderate care points to Silver with cost-sharing reductions. Above 250% FPL with low expected care points to comparing Gold and Bronze and skipping Silver. Heavy or chronic care points to Gold or Platinum, where the out-of-pocket maximum becomes the number that matters most. This is the whole article compressed into one path from your situation to a plan, and the table that follows pins it down by reader profile.
6.4 The Decision at a Glance: Your Situation, Your Plan
To close, here is the entire framework mapped to the situations most readers find themselves in, so you can find your row and read straight across to a plan.
| Reader situation | Best coverage path | Likely tier | HSA? | Watch out for |
|---|---|---|---|---|
| W-2 with affordable employer offer | Employer plan | Employer’s options | If HDHP offered | Limited choice; no PTC |
| 1099 / self-employed, income 100-250% FPL | Marketplace | Silver (CSR) | Only if HDHP | Income estimate accuracy |
| 1099 / self-employed, income >250% FPL | Marketplace | Compare Gold/Bronze | If HDHP + tax goals | Silver loading |
| Low income (<138% FPL, expansion state) | Medicaid | n/a | No | Coverage gap if non-expansion |
| Under 30, healthy, low budget | Catastrophic or Bronze | Catastrophic/Bronze | If HDHP | No PTC on catastrophic |
| Brief gap between jobs, healthy | COBRA or short-term | n/a | No | STLDI excludes pre-existing |
| Heavy/chronic care | Marketplace | Gold/Platinum | Usually no | OOP max is the key number |
Synthesis of the central question; data current as of June 2026.
Every row here traces back to ground we covered earlier, so the table is a recap, not new information. Find the line that matches your job, income, and expected care, and you have your coverage path, your likely tier, the HSA call, and the one thing to watch, all in a single read before you ever open a plan finder.
Conclusion
A health plan is really just a handful of moving parts, and once you can name them you stop guessing. The premium, the deductible, your coinsurance share, and the out-of-pocket maximum all feed one number that decides what a year of care actually costs you, and that number is total annual cost, not the headline premium. The recap table above maps each situation to a path, a likely tier, an HSA decision, and the one risk to watch, so by now you can find your own row before your next enrollment window.
Two things are worth keeping in mind, because they catch people every single year. First, below 250% of the federal poverty level, Silver is the plan to beat, since cost-sharing reductions quietly lift it toward a 94% actuarial-value plan at no extra premium, while above that line Silver loading often makes Gold or Bronze the cheaper after-subsidy deal. Second, if you take the premium tax credit in advance and your income climbs, you can owe it back at tax time, and with the 400% poverty-level cliff back for 2026 that repayment is uncapped above the line. The fix I see work most often is simple: estimate your income conservatively and take a little less credit than the maximum, because any unused amount comes back to you as a refund.
From here, a few topics pick up exactly where this leaves off. The HSA contribution is an above-the-line deduction, so it belongs in the same conversation as the rest of your tax planning, which we lay out in our guide to cutting your taxable income. Run that HSA as a long-game account and it doubles as a quiet retirement vehicle, a move we fold into our guide to building a retirement plan. And once you start investing the balance rather than spending it, what you hold inside the account drives the compounding, which is the thread we pull in our guide to investment taxes.
Frequently Asked Questions
What is the difference between a deductible and an out-of-pocket maximum?
The deductible is what you pay out of your own pocket before the plan starts sharing covered costs, while the out-of-pocket maximum is the annual ceiling on all your cost-sharing combined, meaning the deductible, copays, and coinsurance added together. Once your spending reaches that maximum, the plan covers 100% of covered in-network care for the rest of the year, so it functions as your worst-case number for any single plan year. The part that trips people up is that premiums never count toward either the deductible or the out-of-pocket maximum; you pay them separately every month no matter what. For 2026 the federal out-of-pocket cap is $10,600 for self-only coverage and $21,200 for a family, and that ceiling bounds the worst case for any metal tier you might choose.
Is a high-deductible health plan with an HSA worth it if I rarely go to the doctor?
Often yes, and for two connected reasons. In a low-utilization year the high deductible rarely bites, so the lower premium on a high-deductible health plan (HDHP) tends to win on total annual cost, which is the only number that should decide a plan. On top of that, the health savings account (HSA) gives you a triple tax break: contributions go in pre-tax, the balance grows tax-free, and qualified medical withdrawals come out tax-free, a combination no other US account offers and one worth pairing with the rest of our guide to lowering your taxable income. For 2026 you can contribute $4,400 self-only or $8,750 for a family, plus an extra $1,000 if you are 55 or older, provided the plan is a labeled HSA-eligible HDHP with a minimum deductible of $1,700 self-only or $3,400 family. The trade-off is real, since you carry full exposure to that deductible in a bad year, so keep enough cash on hand to cover it.
Why are short-term health plans so much cheaper, and what is the catch?
They are cheaper because they are medically underwritten and skip the protections that ACA-compliant plans must carry. A short-term insurer can deny you for your health history, exclude any pre-existing condition, and leave out essential health benefits such as maternity care, mental health treatment, and prescription drugs, all of which lowers their cost and their value at the same time. A 2024 federal rule now limits new short-term plans to a 3-month initial term and 4 months of total coverage including renewals, so they are no longer a year-round substitute for real insurance. In practice they suit only a brief gap for someone who is genuinely healthy, because anyone with an ongoing condition or expected care risks large uncovered bills that a Marketplace plan would have paid.
Should I pick a Bronze, Silver, Gold, or Platinum plan?
Match the tier to your expected usage and your subsidy status rather than treating any one label as the safe middle choice. If you expect little care and want the lowest premium, Bronze usually makes sense, while Platinum suits heavy, predictable use where the lower cost-sharing earns back its high premium. If your income is below 250% of the federal poverty level, choose Silver to capture cost-sharing reductions, which quietly raise it to an effective 73% to 94% actuarial-value plan at no extra premium. When you expect regular care, Gold often wins on total annual cost once you add the premium difference to your likely out-of-pocket spending. Above 250% of the poverty level, compare Gold and Bronze directly, because Silver loading can leave a standard Silver plan overpriced after subsidies.



Comments
Questions and corrections welcome. We read everything.