


You want a single, low-cost fund to build your portfolio around, and every option swears it tracks the market for next to nothing. So you sit there staring at VOO, VTI, and FZROX, and you genuinely can’t tell whether a 0.03% S&P 500 ETF beats a literally free total-market mutual fund, whether the index fund vs ETF wrapper changes your taxes, or which one to actually click “buy” on. Guess wrong and you won’t lose much in fees, but you can still end up stuck with a fund locked to one broker, or a bond fund quietly handing the IRS extra tax every single year.
Here’s the part that surprises most people. On $10,000, the entire expense ratio difference between the cheapest fund and the priciest is about $5 a year, roughly one fancy coffee. The decisions that actually matter in 2026 aren’t about that small difference. They’re the etf vs mutual fund wrapper and which account you hold each fund in.
Before I rank the funds, we’ll look at the scorecard I use. Then, I’ll make a clear recommendation based on your situation, whether you want a single fund or a full three-fund portfolio.
1. How we compared these funds: the criteria that actually move the needle
So, what differentiates the seven funds in this comparison? Here is the scorecard I use to evaluate them and explain why each line matters to you.
1.1 The seven funds and the criteria we score them on
The panel consists of seven core funds, each chosen for a specific purpose. VOO, SWPPX, and IVV track the S&P 500 (U.S. large cap). VTI and FZROX own the entire U.S. market. BND is the bond component, providing stability. VXUS owns everything outside the US, the international leg. These are the building blocks of every diversified portfolio.
I rate each one on seven dimensions, mapped in the table below. Two of them have a hidden trap worth knowing up front. Tax efficiency only matters in a taxable account, and a fund that is free at its home broker can cost you a transaction fee at a rival one. Here is the map.
The criteria that actually move the needle
| Criterion | What it measures | Why it matters to you |
|---|---|---|
| Expense ratio | Annual fee skimmed from assets | Direct, guaranteed drag on returns every year |
| Wrapper (ETF vs mutual fund) | Legal structure and trading mechanism | Drives tax efficiency and how you trade |
| Index tracked | What slice of the market is captured | Determines diversification and the fund’s job |
| Tax efficiency | Capital-gains distributions, dividend type | Only relevant in a taxable account |
| Minimum investment | Smallest amount to buy in | Gates access for small or first-time investors |
| Commission/availability | Cost and place to trade | A non-house fund can cost a fee at a rival broker |
| Liquidity / tracking | Spread, volume, tracking difference | Hidden cost beyond the headline expense ratio |
1.2 The seven funds at a glance
Here is the full lineup in a table before we examine any of the funds. As you read down the expense ratio column, you’ll notice how similar they are: every fund here runs between 0.00% and 0.05%.
The seven funds at a glance (summary scorecard)
| Fund (ticker) | Job | Wrapper | Expense ratio | Index tracked | Issuer |
|---|---|---|---|---|---|
| VOO | S&P 500 large-cap | ETF | 0.03% | S&P 500 | Vanguard |
| VTI | Total US market | ETF | 0.03% | CRSP US Total Market | Vanguard |
| FZROX | Total US market | Mutual fund | 0.00% | Fidelity US Total Investable Market | Fidelity |
| SWPPX | S&P 500 large-cap | Mutual fund | 0.02% | S&P 500 | Schwab |
| IVV | S&P 500 large-cap | ETF | 0.03% | S&P 500 | iShares (BlackRock) |
| BND | Total US bond | ETF | 0.03% | Bloomberg US Aggregate Float Adjusted | Vanguard |
| VXUS | Total international stock | ETF | 0.05% | FTSE Global All Cap ex US | Vanguard |
Data current as of June 2026.
1.3 How much diversification each fund actually buys
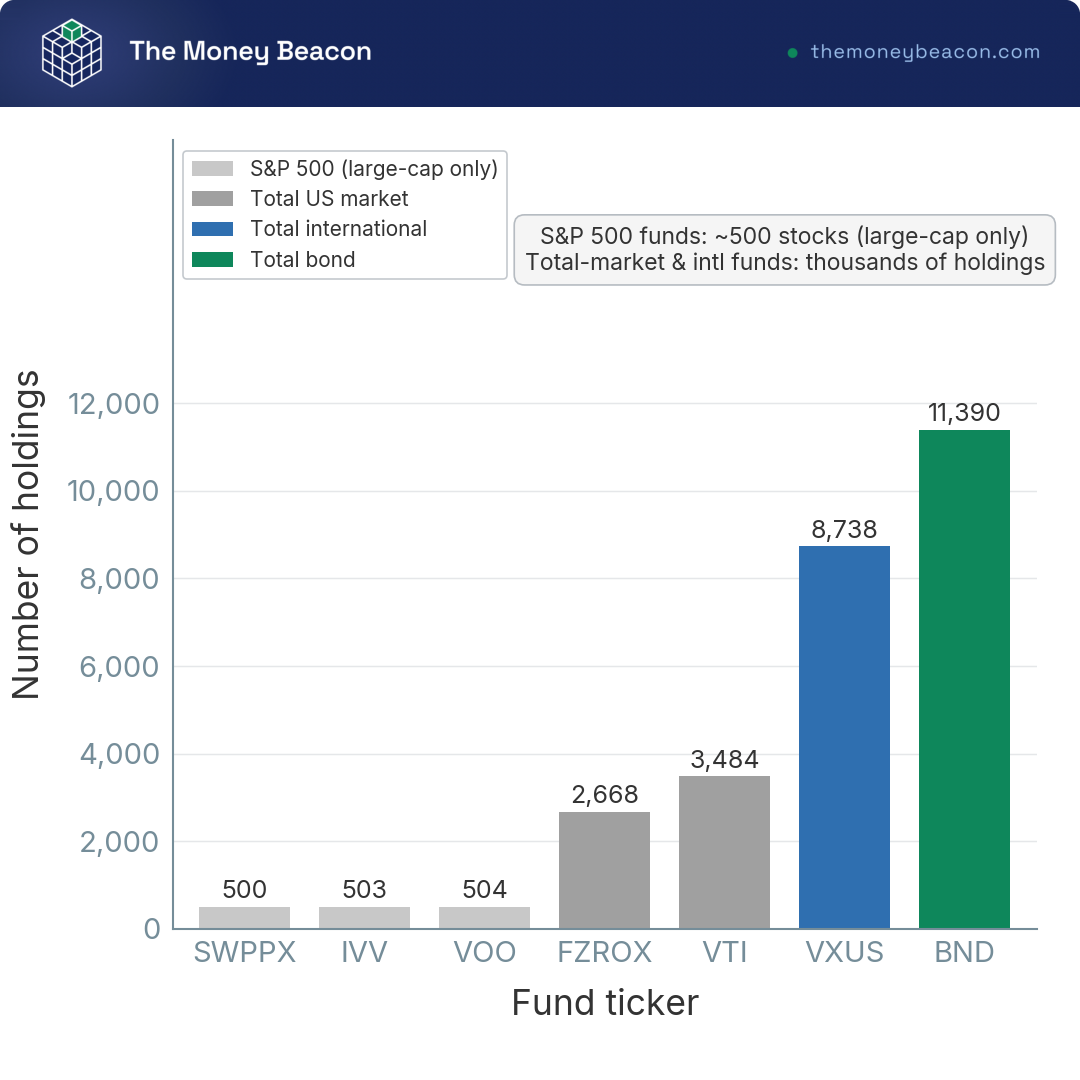
The key difference between these funds is how many securities each one holds. The three S&P 500 funds (VOO, IVV, SWPPX) each own roughly 500 of the largest US companies. Step up to a total-market fund and the count increases: VTI holds about 3,484 stocks, FZROX about 2,668. Go global and BND holds about 11,390 bonds, VXUS about 8,738 non-US stocks.
The number of holdings, not the expense ratio, is the real fork in the road. Even when they cost the same $3 a year, a 500-stock S&P 500 fund and a 3,484-stock total-market fund are doing different jobs.
1.4 What cost really means: dollars per $10,000
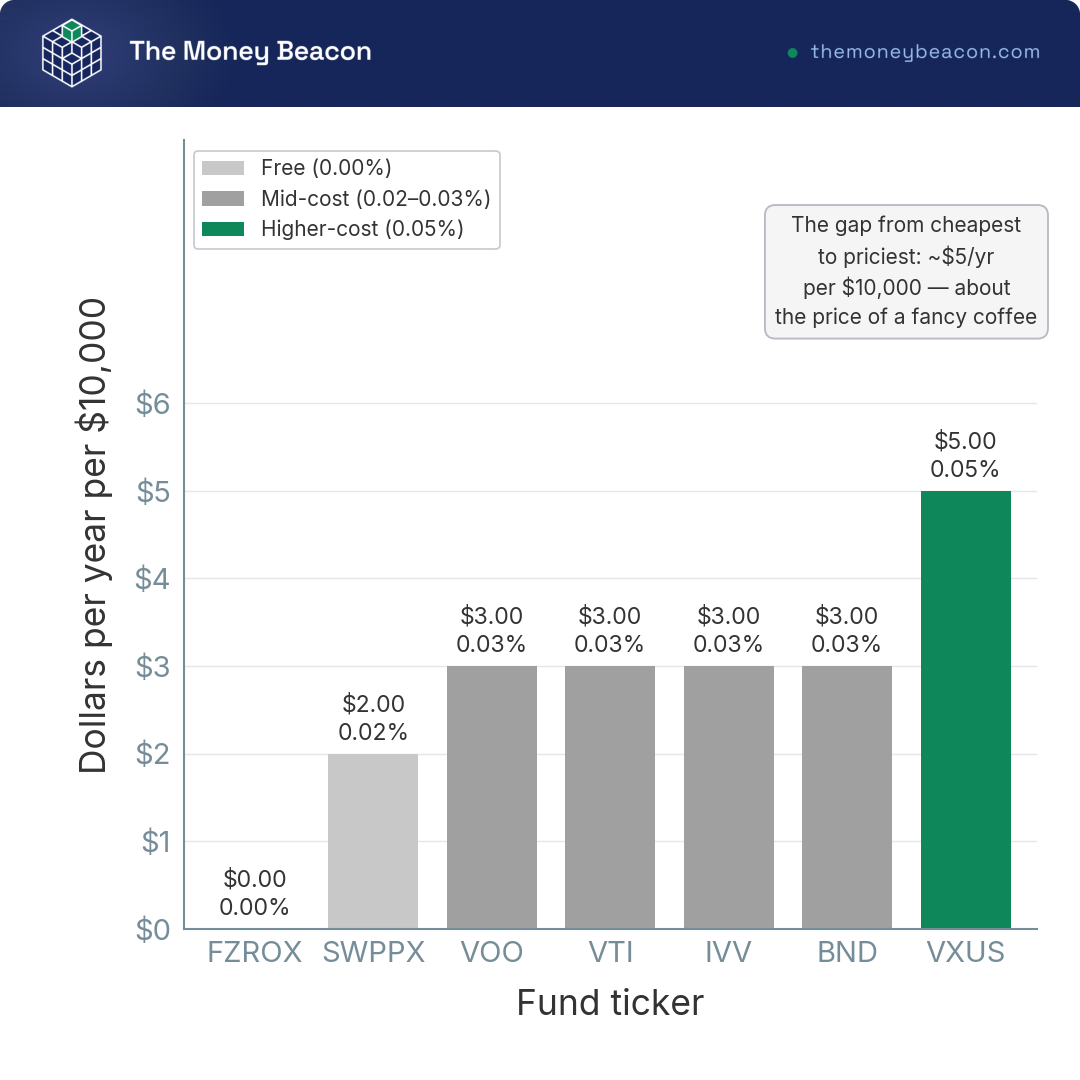
A percentage like 0.03% is abstract, so let me put it in dollars on a $10,000 balance. FZROX charges you $0 a year. SWPPX charges $2. The four 0.03% funds (VOO, VTI, IVV, BND) each charge $3. VXUS, the priciest, charges $5.
Cost is almost never the deciding factor between these seven funds. Pick the one whose job and wrapper fit your situation, and the few dollars of fee become irrelevant.
1.5 ETF vs index mutual fund: the wrapper that drives tax and trading
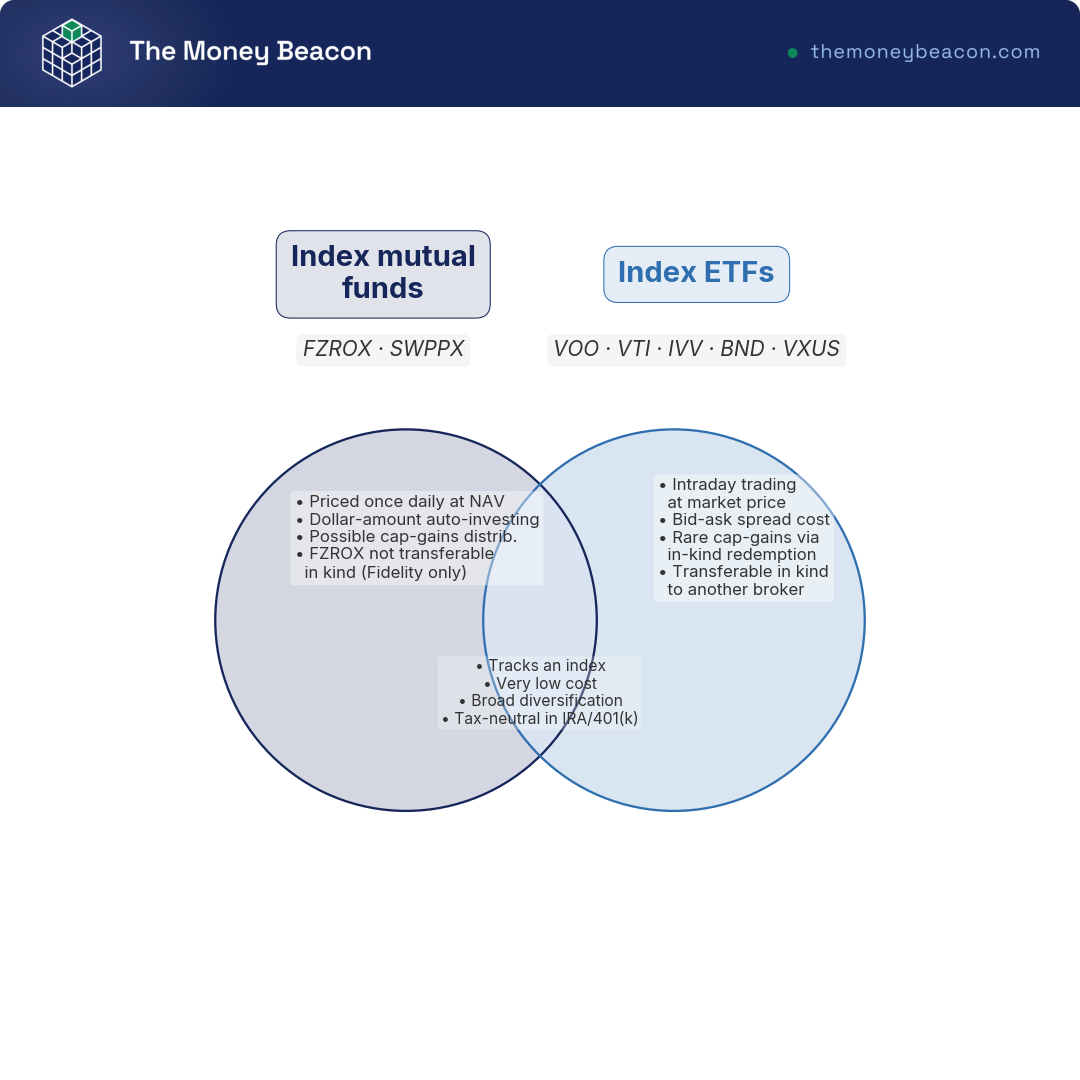
If cost barely matters, the wrapper is where the real differences lie. An ETF trades intraday on an exchange at a market price that sits slightly above or below net asset value (NAV), and it carries a small bid-ask spread. A conventional mutual fund is priced once a day at NAV after closing, and it lets you invest a flat dollar amount natively.
The part that changes your tax bill is the redemption process. Under SEC Rule 6c-11, the ETF Rule that took effect in 2019, ETFs use an in-kind creation and redemption process that allows the fund to transfer its lowest-basis shares without selling them. The practical result is that broad equity ETFs rarely distribute capital gains. When other shareholders cash out, a mutual fund may have to sell appreciated holdings and pass the gain pro-rata to everyone left, including you, even if you never sold a share. One exception: FZROX tracks a proprietary index and cannot be transferred in kind.
If you bank and invest with the same institution, the overlap is usually not an issue. However, if you are choosing a broker first, our comparison of the best online brokerage accounts explains which ones let you trade what for free.
1.6 Accounts vs asset classes: the container changes everything
Here is the distinction that trips up more beginners than any fee ever will. The seven funds are asset classes; they are what you own. A taxable brokerage account, a traditional IRA, a 401(k), and a Roth IRA are containers; they are the things in which you own the asset classes. The same fund behaves differently depending on the container it’s in.
Tax-wrapper efficiency only makes a difference in a taxable account. Inside an IRA or 401(k), capital gains distributions are not taxed, so an index mutual fund and an equivalent ETF behave similarly in those accounts. One more guardrail: none of these funds are FDIC-insured. Your broker carries SIPC coverage, which protects you in the event of brokerage failure, not market loss.
Accounts vs asset classes: tax treatment by container
| Container (account) | Tax on capital-gains distribution | Tax on dividends/interest while held | Wrapper tax efficiency matters? |
|---|---|---|---|
| Taxable brokerage | Taxed in year received | Taxed yearly (qualified vs ordinary) | Yes, strongly |
| Traditional IRA / 401(k) | Not taxed until withdrawal | Not taxed until withdrawal | No |
| Roth IRA | Not taxed (qualified withdrawals tax-free) | Not taxed | No |
This account-level decision determines how each of these funds is taxed. We discuss asset location and capital-gains treatment in more detail in our full tax guide.
1.7 Where each fund sits on risk and return
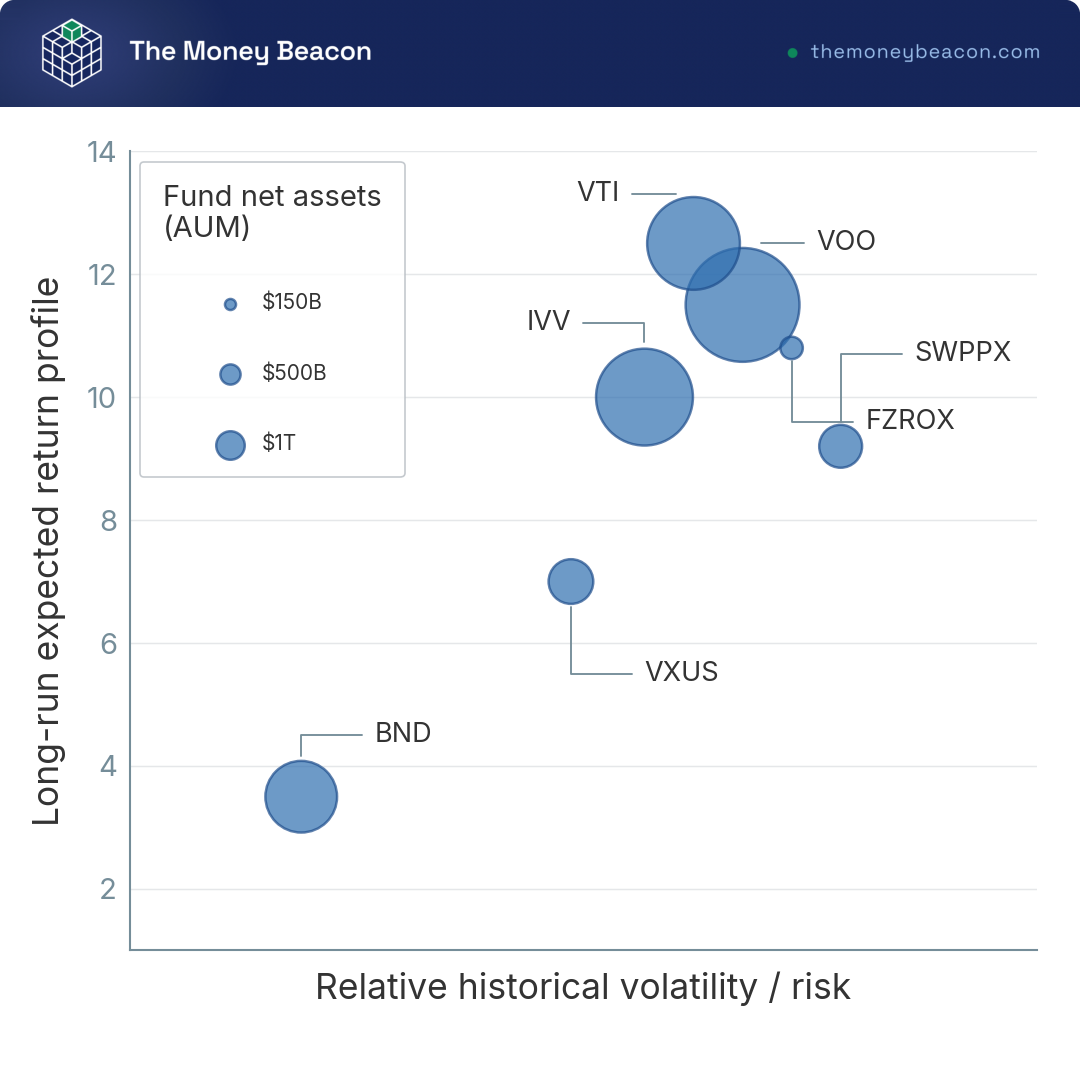
Once you hold the wrapper rule and the container rule, a risk-return map finally reads with meaning. The five equity funds (VOO, VTI, IVV, FZROX, SWPPX) cluster together at higher risk and higher long-run return, because they all own US stocks. BND sits off on its own at low risk and low return, the ballast leg. VXUS lands at moderate-to-high risk, carrying currency exposure and a split of about 74% developed markets and 26% emerging. Fund size relates loosely to where a fund sits, but it has nothing to do with cost.
Once you understand the wrapper rule and the container rule, the risk-return map finally makes sense. The five equity funds (VOO, VTI, IVV, FZROX, and SWPPX) cluster together in the higher-risk, higher-long-run-return area because they all own US stocks. BND sits off by itself at low risk and low return, acting as the ballast leg. VXUS lands at moderate-to-high risk because it carries currency exposure and is split about 74% developed markets and 26% emerging markets. Fund size loosely relates to where a fund sits, but it has nothing to do with cost.
Hank’s take

When you follow Fed policy closely, you stop treating BND’s duration as a footnote. A 6.5-year duration is a live variable, not a static label. It’s the one number on this map that can move against you quickly in a rate cycle.
1.8 How we got here: the launches and rules behind these funds
A little history explains why our lineup for this comparison looks the way it does. Schwab’s SWPPX, the oldest in the group, launched back in 1997. The S&P 500 and total-market ETFs followed, with IVV launching in 2000 and VTI in 2001. Then, in 2007, BND brought the bond leg, and VOO and VXUS arrived in 2010 and 2011, respectively. In 2018, Fidelity introduced the first 0.00% true index fund, FZROX. In 2019, the SEC standardized the in-kind redemption process that underpins ETF tax efficiency with Rule 6c-11. Vanguard further reduced expense ratios across 2025 and 2026.
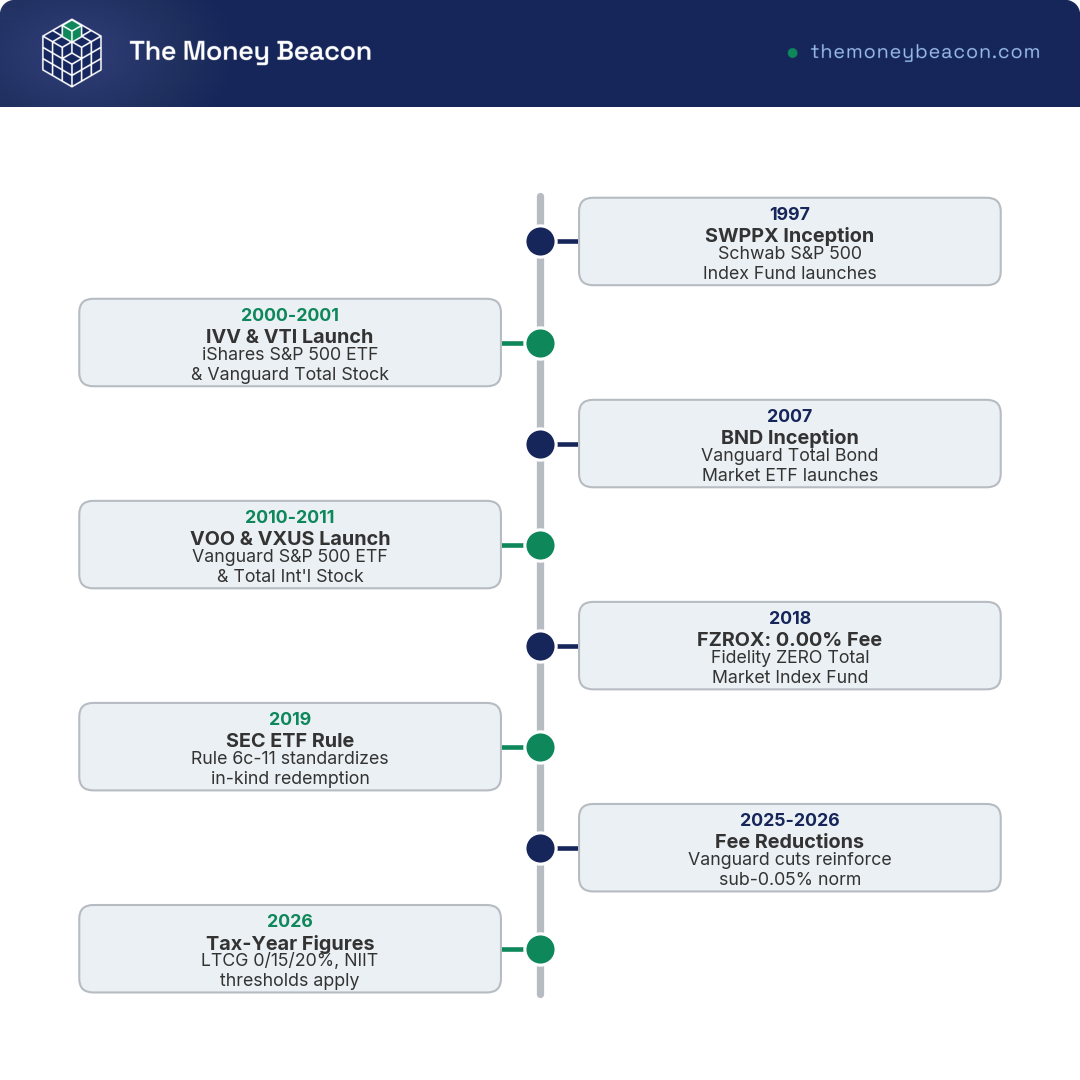
The tax figures that inform the decisions below are the 2026 ones: long-term capital gains are taxed at 0%, 15%, or 20% depending on income. With the scorecard set, here is the first fund on it.
2. Vanguard S&P 500 ETF (VOO): the default large-cap equity core
Is VOO the right way to own the S&P 500 if you plan to buy and hold for decades? Here is the full review.
2.1 Overview
VOO is Vanguard’s S&P 500 ETF, tracking about 504 of the largest US companies weighted by size. At roughly $995.5 billion in net assets (as of 05/31/2026), it is one of the biggest funds on the planet. Its job is straightforward: to provide pure, low-cost, buy-and-hold exposure to US large-cap stocks with a single ticker symbol.
2.2 Strengths
The fee is extremely low at 0.03%, or $3 per year for every $10,000 invested. Thanks to the ETF wrapper, capital gains distributions are rare, making VOO highly efficient in a taxable account. Most of its dividends are qualified and taxed at the lower long-term capital gains rates. You can purchase VOO commission-free through every major brokerage firm and transfer it if you ever switch, so you are never locked in. Add deep liquidity and tight tracking, and you have very little to worry about.
2.3 Weaknesses
The flip side of focus is narrowness. VOO only owns the S&P 500, so you won’t find any mid-, small-, or micro-cap stocks, nor any international exposure. Its income is modest, with a 30-day SEC yield of 1.00% as of May 31, 2026. A bid-ask spread applies to every trade, though it is minimal for such a liquid fund. It is not the cheapest option, since a 0.00% fund exists.
2.4 Pricing & fees
The numbers behind VOO are about as plain as can be.
Vanguard S&P 500 ETF (VOO) key metrics
| Metric | Value |
|---|---|
| Expense ratio | 0.03% ($3 per $10,000) |
| Minimum investment | Price of 1 share (fractional at many brokers) |
| 30-day SEC yield | 1.00% |
| Commission | Free at major brokers |
| In-kind transfer | Yes |
Data current as of June 2026.
2.5 Who it’s for
VOO is ideal for S&P 500 purists who want pure US large-cap exposure in an ETF with high tax efficiency and the freedom to switch brokers at any time. However, it is not the right choice if you want exposure to the entire US market in a single ticker or if you are set on a 0.00% fee with a specific broker. Next, decide if “the 500 biggest” is what you’re looking for, or if you want the rest of the market too. Over time, a low-cost index fund quietly beats most active managers, so the harder question is scope, not whether to index at all.
3. Vanguard Total Stock Market ETF (VTI): the whole US market in one ticker
Should a one-fund investor own the entire US market through VTI rather than just the largest 500 companies?
3.1 Overview
VTI is Vanguard’s total-US-market ETF, holding about 3,484 stocks spanning large, mid, small, and micro caps via the CRSP US Total Market Index, with roughly $660.7 billion in assets (as of 05/31/2026). In one low-cost ticker, it captures essentially the entire investable US stock market, not just the headline names.
3.2 Strengths
The main strength is breadth: about 3,484 holdings, versus roughly 500 in an S&P 500 fund, so you own the whole US market in a single ticker. It costs the same 0.03%, or $3 per $10,000, as the large-cap-only option. The ETF wrapper keeps capital gains distributions rare and taxable account efficiency high. Dividends are mostly qualified, and you can trade it commission-free anywhere and transfer it in kind. For a beginner, this makes it an ideal core holding.
3.3 Weaknesses
VTI is still US-only, so it leaves out international stocks entirely; if you want global coverage, you pair it with a total-international fund. Its income is modest at a 30-day SEC yield of 1.01% (as of 05/31/2026). And here is the honest limit: the extra small- and mid-cap names only slightly impact its returns versus a large-cap-only fund historically because mega-caps dominate both. A small bid-ask spread applies, and like the others, it is not literally free.
3.4 Pricing & fees
VTI’s card resembles its large-cap sibling’s, except for one key difference: the number of holdings.
Vanguard Total Stock Market ETF (VTI) key metrics
| Metric | Value |
|---|---|
| Expense ratio | 0.03% ($3 per $10,000) |
| 30-day SEC yield | 1.01% |
| Minimum investment | Price of 1 share (fractional at many brokers) |
| Holdings | ~3,484 |
| Commission | Free at major brokers |
| In-kind transfer | Yes |
Data current as of June 2026.
3.5 Who it’s for
VTI is the best choice for beginners who want a single, transferable ETF covering the entire U.S. market. It is also the natural U.S. stock component of a three-fund portfolio. However, it is not the right choice if you specifically want exposure to the large-cap S&P 500 only, or if you are committed to a 0.00% fee with one particular broker. If you would rather not pick funds and prefer to have everything managed for you, our Vanguard brokerage review covers where to find VTI and how to set up automatic purchases.
4. Fidelity ZERO Total Market Index Fund (FZROX): the 0.00% fee with strings attached
An expense ratio of 0.00% sounds like the end of the argument. But is a free, total-market fund worth the broker lock-in? Here’s the deal:
4.1 Overview
FZROX, Fidelity’s total US market index mutual fund, holds about 2,668 stocks across the cap spectrum through a proprietary Fidelity index. As of 05/31/2026, it has roughly $38.6 billion in assets. FZROX launched in 2018 as the first true zero-fee index fund. It serves the same purpose as a total-market ETF in that you essentially own the entire US stock market with one holding. The one thing that sets it apart is structural. You can only own it inside a Fidelity account.
4.2 Strengths
The headline is the fee, and it is genuine: 0.00%, or $0 a year on any balance, the cheapest holding in this comparison. There is no minimum either, so your first dollar buys in. As a total-market fund, it allocates your investment across approximately 2,668 stocks. As a mutual fund, it supports automatic investing in dollar amounts without the need for a fractional-share workaround. Hold it inside a Fidelity IRA, and you will enjoy all these benefits without any drawbacks because lock-in and distribution risk only matter in a taxable account.
4.3 Weaknesses
The zero fee is real, but the cost shows up elsewhere. Since the index is proprietary, FZROX cannot be transferred in kind. This means that on the day you decide to leave Fidelity, you must sell. Selling in a taxable account is a taxable event that you may not want to trigger. As a mutual fund, it can also pass through capital gains distributions that you cannot control. This is the kind of thing that an equity ETF mostly avoids. It is priced once a day at NAV rather than intraday, and it is available at only one broker.
4.4 Pricing & fees
The numbers here are small; the lock-in, not the fee, is the real cost, so remember the availability row.
Fidelity ZERO Total Market Index Fund (FZROX) key metrics
| Metric | Value |
|---|---|
| Expense ratio | 0.00% ($0 per $10,000) |
| Minimum investment | $0 |
| Holdings | ~2,668 |
| Index | Fidelity proprietary |
| 30-day SEC yield | Not disclosed |
| Availability | Fidelity accounts only |
Data current as of June 2026.
4.5 Who it’s for
FZROX is the best choice for the lowest-cost-obsessed investor who is committed to Fidelity and holds it inside an IRA, where the lock-in and the capital-gains-distribution risk are both neutralized. It is not the right choice for a taxable account you might one day move out of Fidelity, or for anyone who values broker portability, where a transferable ETF such as VTI fits better. Your next move is to check which account you would use, because that will determine whether the drawbacks even matter. If you want to see how the zero-fee account itself is set up, our Fidelity account review walks through where FZROX is located and how to automate buying it.
5. Schwab S&P 500 Index Fund (SWPPX): the low-cost mutual-fund route to the S&P 500
Some investors want the S&P 500 but prefer a mutual fund’s dollar-amount auto-investing over an ETF’s share-based trading. Is SWPPX the right fund for that, if you bank at Schwab?
5.1 Overview
SWPPX is Schwab’s S&P 500 index mutual fund, tracking about 500 US large-cap stocks, with a 0.02% expense ratio, no minimum, and roughly $141.2 billion in assets (as of 06/26/2026). It launched in 1997, which makes it the elder statesman of this group, and it trades commission-free at Schwab.
5.2 Strengths
The fee is very low at 0.02%, or $2 a year per $10,000, the cheapest of the S&P 500 options in this comparison, and there is no minimum to start. As a mutual fund it offers native dollar-amount automatic investing, so a flat $200 a paycheck flows in without any fractional-share step. It tracks the standard S&P 500 benchmark, so its dividends are mostly qualified and taxed at the lower long-term capital-gains rates. At Schwab it trades commission-free, which makes it a clean, simple core for a Schwab loyalist who likes mutual funds.
5.3 Weaknesses
Since it is a house fund, buying SWPPX through a different broker may incur a transaction fee, whereas any of the S&P 500 ETFs can be traded for free. As a mutual fund, it can pass through capital gains distributions, making it slightly less tax-efficient than an equivalent ETF in a taxable account. However, that gap disappears in an IRA. It only owns the S&P 500, so it provides no exposure to mid-cap, small-cap, or international stocks. It prices once a day at net asset value (NAV), not intraday, so you cannot buy or sell at the current price during the trading day.
5.4 Pricing & fees
The card is simple, with one line that merits a closer look: availability.
Schwab S&P 500 Index Fund (SWPPX) key metrics
| Metric | Value |
|---|---|
| Expense ratio | 0.02% ($2 per $10,000) |
| Minimum investment | $0 |
| Index | S&P 500 |
| 30-day SEC yield | Not disclosed |
| Availability | Schwab and many fund platforms; possible fee elsewhere |
Data current as of June 2026.
5.5 Who it’s for
SWPPX is the best choice for the S&P 500 purist who banks at Schwab and prefers a mutual fund with native auto-investing and no minimum. It is not the right choice for an investor at a different broker who would face a transaction fee to buy it, or for one chasing maximum taxable-account tax efficiency, where an equity ETF such as VOO or IVV fits better. So the deciding question is where you already bank, since that is what makes the house-fund advantage real or irrelevant. If Schwab is or might be your primary bank, our Charles Schwab account review explains how to set up recurring purchases of SWPPX and how to trade it for free.
6. iShares Core S&P 500 ETF (IVV): BlackRock’s S&P 500 ETF, VOO’s direct rival
By the time you reach IVV, the question changes. It does almost exactly what VOO does. Does IVV give S&P 500 investors a good enough reason to choose it?
6.1 Overview
IVV is the iShares (BlackRock) Core S&P 500 ETF, tracking 503 US large-cap stocks, with roughly $720.5 billion in assets (as of 03/31/2026). As the world’s largest asset manager, BlackRock built IVV for the same purpose as a Vanguard S&P 500 ETF: to provide low-cost, buy-and-hold exposure to the 500 largest US companies. Its mandate and cost are nearly identical to those of its rival.
6.2 Strengths
With a fee of 0.03%, or $3 per $10,000 annually, it matches the cheapest large-cap ETFs in this comparison. As an ETF, it has the tax advantages of the wrapper: capital gains distributions are rare, making it efficient in a taxable account, and most of its dividends are qualified. You can purchase it commission-free through every major brokerage firm and transfer it whenever you switch, so you are never locked in. Deep liquidity keeps spreads tight. If you already hold other iShares Core funds, this ETF slots straight into that ecosystem.
6.3 Weaknesses
IVV only owns the S&P 500, so you get large-cap concentration with no mid-cap, small-cap, or international names. Its bigger limitation is that it is functionally interchangeable with the Vanguard S&P 500 ETF, so if you are already standardized on Vanguard there is no decisive edge to switching. Income is modest at a 30-day SEC yield of 1.12% (as of 03/31/2026). A small bid-ask spread applies on each trade, tiny for a fund this liquid, and it is not the absolute cheapest, since a 0.00% and a 0.02% option both exist.
6.4 Pricing & fees
IVV’s numbers read almost exactly like a Vanguard S&P 500 ETF’s.
iShares Core S&P 500 ETF (IVV) key metrics
| Metric | Value |
|---|---|
| Expense ratio | 0.03% ($3 per $10,000) |
| 30-day SEC yield | 1.12% |
| Holdings | 503 |
| Minimum investment | Price of 1 share (fractional at many brokers) |
| Commission | Free at major brokers |
| In-kind transfer | Yes |
Data current as of June 2026.
6.5 Who it’s for
IVV is ideal for S&P 500 purists who prefer the iShares/BlackRock ecosystem and want a tax-efficient, transferable ETF offering pure large-cap exposure. However, it is not the right choice for investors who want total US market exposure in one ticker or who are already invested in Vanguard’s equivalent S&P 500 ETF. The deciding factor is rarely the fund itself, but rather which fund family you already use.
7. Vanguard Total Bond Market ETF (BND): the stability leg of a diversified portfolio
A diversified portfolio needs a bond leg for stability, so how should you actually use BND for that job? Here is my take on it.
7.1 Overview
Vanguard’s BND is an ETF that tracks the entire U.S. bond market. It holds approximately 11,390 investment-grade bonds through the Bloomberg U.S. Aggregate Float Adjusted Index and has roughly $394.4 billion in assets (as of May 31, 2026). Its average effective duration is approximately 6.5 years. The bonds are mostly US government and agency debt, including Treasurys, agency mortgage-backed securities, and investment-grade corporates. Its purpose is not to generate growth. BND is ballast, the holding that cushions the swings of your stock funds.
7.2 Strengths
In one cheap ticker you own broad investment-grade US bond exposure, about 11,390 of them, at the same 0.03%, or $3 a year per $10,000, as the equity ETFs. The income is the standout right now: a 30-day SEC yield of 4.50% (as of 06/25/2026), well above what the bond leg paid through the long stretch of near-zero rates. As an ETF it keeps capital-gains distributions rare, trades commission-free everywhere, and transfers in kind. Its real purpose, though, is portfolio behavior: it dampens the volatility of your equity holdings and gives you something stable to rebalance into when stocks fall.
7.3 Weaknesses
The catch is how that income gets taxed. BND’s distributions are ordinary-income interest, taxed at your regular rate of 10% to 37%, which makes it the least tax-efficient fund in this comparison inside a taxable account. It also carries real interest-rate risk: at about 6.5-year duration, a 1-point rise in rates implies roughly a 6.5% price decline, so a bond fund can and does lose value. Its long-run expected return sits below stocks by design, since this is a cushion, not a growth engine. Because of that tax treatment, BND belongs in a 401(k) or other tax-advantaged account whenever you can manage it.
7.4 Pricing & fees
The fee table reads like the equity ETFs, but two rows here have no equivalent on a stock fund’s card: duration and maturity.
Vanguard Total Bond Market ETF (BND) key metrics
| Metric | Value |
|---|---|
| Expense ratio | 0.03% ($3 per $10,000) |
| 30-day SEC yield | 4.50% |
| Average effective duration | ~6.5 years |
| Average effective maturity | ~8.15 years |
| Number of bonds | ~11,390 |
| Index | Bloomberg US Aggregate Float Adjusted |
Data current as of June 2026.
7.5 Who it’s for
BND is the best choice for the three-fund builder who wants a single, broad bond leg for ballast, held inside an IRA or 401(k) so its ordinary-income interest is sheltered from tax. It is not the right choice for a young investor seeking maximum growth, or for a high-bracket investor who would park it in a taxable account and hand the IRS ordinary-income tax on every distribution.
8. Vanguard Total International Stock ETF (VXUS): the global diversification leg
Every fund reviewed so far stops at the US border. Do you actually need to cross it, and how does VXUS fit a portfolio built on US stocks and bonds?
8.1 Overview
VXUS is Vanguard’s total-international-stock ETF, holding about 8,738 non-US companies across developed and emerging markets through the FTSE Global All Cap ex US Index, with roughly $153.2 billion in assets (as of 05/31/2026). The split is approximately 74% developed markets and 26% emerging markets. It offers what every US-only fund lacks: exposure to the rest of the world’s stock markets in a single ticker.
8.2 Strengths
The whole point is diversification beyond the US: about 8,738 stocks spread across developed and emerging markets. This reduces the risk of single-country concentration that a US-only portfolio carries by definition. It stays cheap at 0.05%, or $5 a year per $10,000, still tiny even as the priciest fund here. In a taxable account, you can claim a foreign tax credit that will offset some of the foreign tax withheld on its dividends. You can buy it commission-free anywhere, and it remains the standard way to add international exposure to a portfolio.
8.3 Weaknesses
International stocks carry their own drag. VXUS adds currency risk, and emerging-market swings widen the range of outcomes year to year. International equities have also lagged US large-cap for much of the past decade, so the diversification case is structural, not a promise of higher returns. The foreign tax credit, one of its nicer features, is mostly a taxable-account benefit and is largely lost inside an IRA. Its income is mixed: it has a dividend yield of about 2.36%, but the 30-day SEC yield is not disclosed by Vanguard. And strictly speaking, you don’t need it, since US-only portfolios have done well historically.
8.4 Pricing & fees
The fee is the highest in this comparison, yet it still amounts to pocket change. The card adds one feature that no US fund needs: a developed versus emerging split that shows the international risk you are taking on.
Vanguard Total International Stock ETF (VXUS) key metrics
| Metric | Value |
|---|---|
| Expense ratio | 0.05% ($5 per $10,000) |
| Dividend yield | ~2.36% (30-day SEC yield not disclosed) |
| Holdings | ~8,738 |
| Developed / emerging split | ~74% / ~26% |
| Index | FTSE Global All Cap ex US |
Data current as of June 2026.
8.5 Who it’s for
VXUS is the best choice for the three-fund builder who wants genuine global diversification and, in a taxable account, the foreign tax credit that comes with holding international stocks directly. It is not the right choice for an investor who prefers to stay US-only, or for one who would hold it inside an IRA, where the foreign tax credit is lost. With both the bond and international legs on the table, every fund in this comparison has been reviewed. The only questions left are how they stack up against each other and which one is right for you.
9. The verdict: comparing all seven side by side and matching each to a profile
I reviewed each fund individually. Now, I compiled all seven into a single table so that the trade-offs, which were previously spread across nine sections, can be viewed together.
9.1 All seven funds side by side
Summary table (answer to the central question)
| Fund (ticker) | Job in portfolio | Wrapper | Expense ratio | Tax efficiency (taxable acct) | Where commission-free | Best for |
|---|---|---|---|---|---|---|
| VOO | S&P 500 large-cap | ETF | 0.03% | High | All major brokers | S&P 500 purist (ETF) |
| VTI | Total US market | ETF | 0.03% | High | All major brokers | One-fund beginner; 3-fund US leg |
| FZROX | Total US market | Mutual fund | 0.00% | Moderate; not transferable | Fidelity only | Cost-obsessed; mutual-fund fan (in IRA) |
| SWPPX | S&P 500 large-cap | Mutual fund | 0.02% | Moderate | Schwab (fee elsewhere) | S&P 500 purist (mutual fund) |
| IVV | S&P 500 large-cap | ETF | 0.03% | High | All major brokers | S&P 500 purist (iShares ecosystem) |
| BND | Total US bond | ETF | 0.03% | Low (ordinary income; best in IRA) | All major brokers | 3-fund bond ballast |
| VXUS | Total international | ETF | 0.05% | Moderate-high (foreign tax credit) | All major brokers | 3-fund international leg |
Data current as of June 2026.
The main point to take away from that table is that all seven are extraordinarily cheap, so the real decisions are the wrapper and the account, not the fee.
9.2 Cost compared: what the expense ratio really costs
Start with cost because it is the easiest to understand and the factor that most people overestimate. Convert the percentages to dollars on $10,000 and the entire gap from cheapest to priciest is about $5 a year, roughly a fancy coffee.
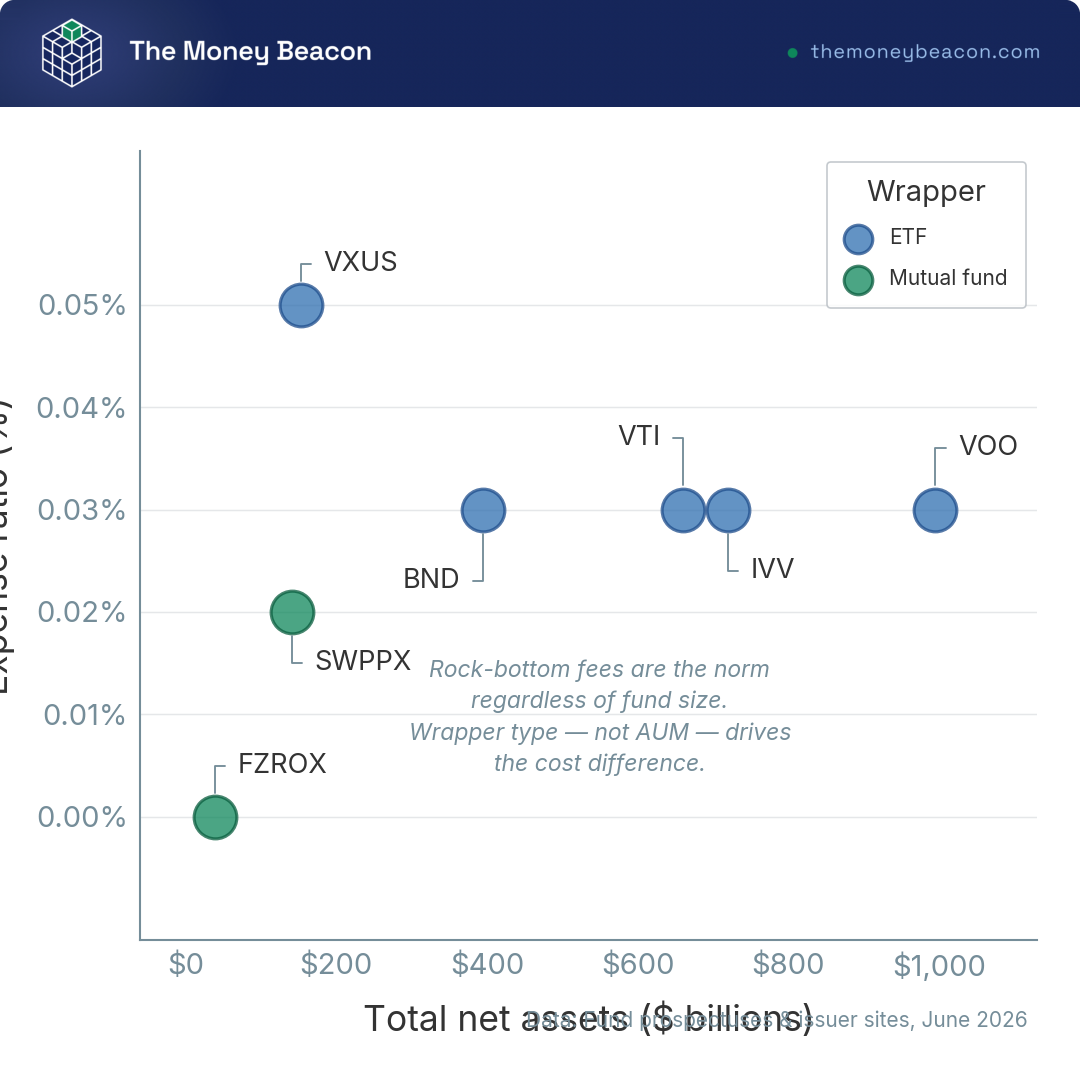
When you map cost against fund size, the lesson is clear: the cheapest fund is one of the smallest, while the largest carries the standard 0.03% fee. Regardless of scale, rock-bottom fees are now the norm.
9.3 How small fees compound over 30 years
It is fair to ask whether the difference in fees matters over a lifetime of holding. Maintain a $100,000 balance with a 7% gross annual return for 30 years across the 0.00%, 0.03%, and 0.05% lines, and even in the 30th year, the difference between the cheapest and priciest options remains modest in absolute terms.
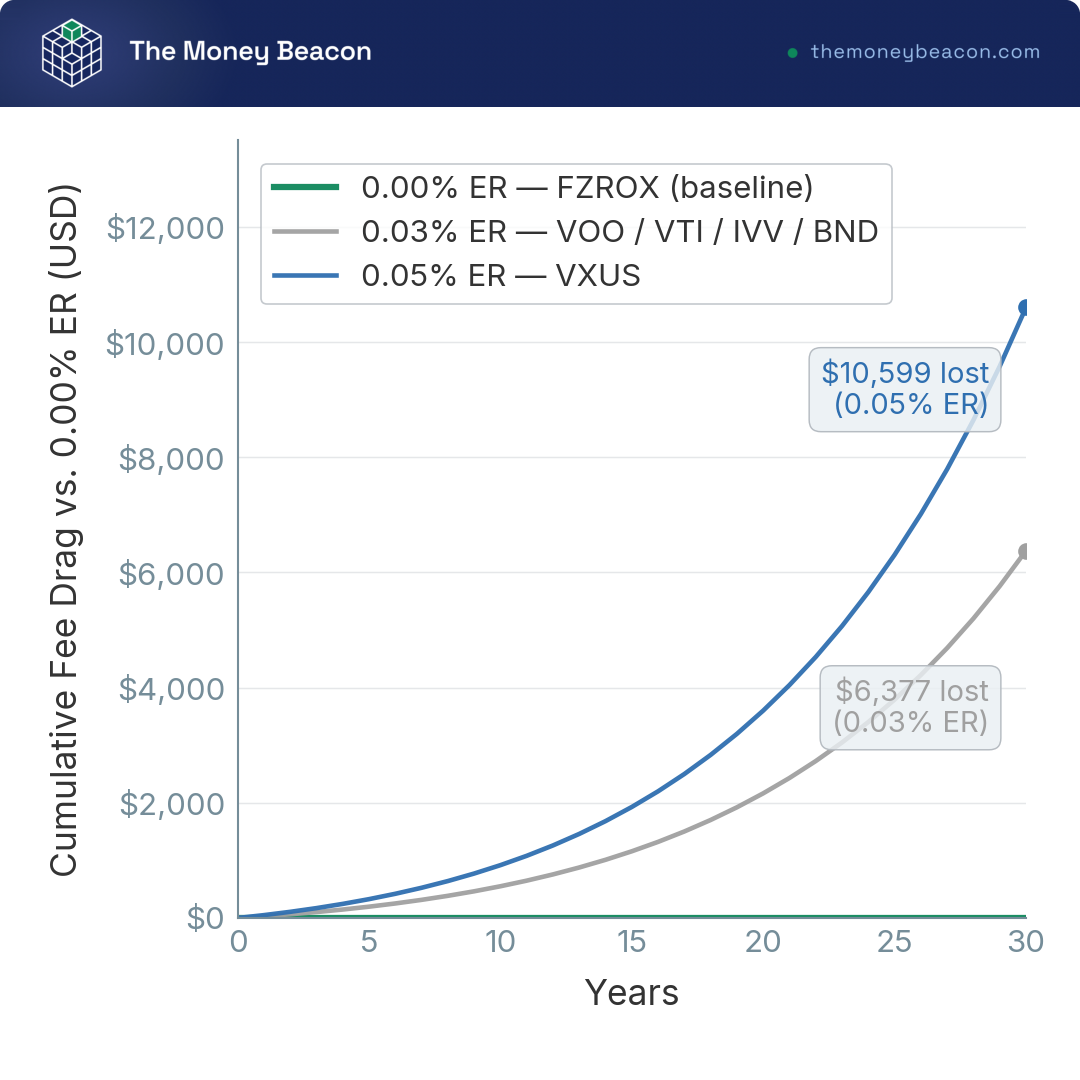
So the main takeaway is one of proportion. Fee differences this small are real but get dwarfed by the tax and behavioral decisions that I look at next.
9.4 Tax efficiency: which fund belongs in which account
This is where the funds diverge. In a taxable account, equity ETFs (VOO, VTI, and IVV) are the most tax-efficient because the wrapper keeps capital gains distributions rare, and their dividends are mostly qualified. VXUS falls in the moderate-to-high range, helped by the possible foreign tax credit. The two mutual funds (FZROX and SWPPX) are in the middle in terms of capital gains distribution risk. BND is the outlier because its ordinary-income interest is the least tax-friendly distribution here and is best sheltered in an IRA.
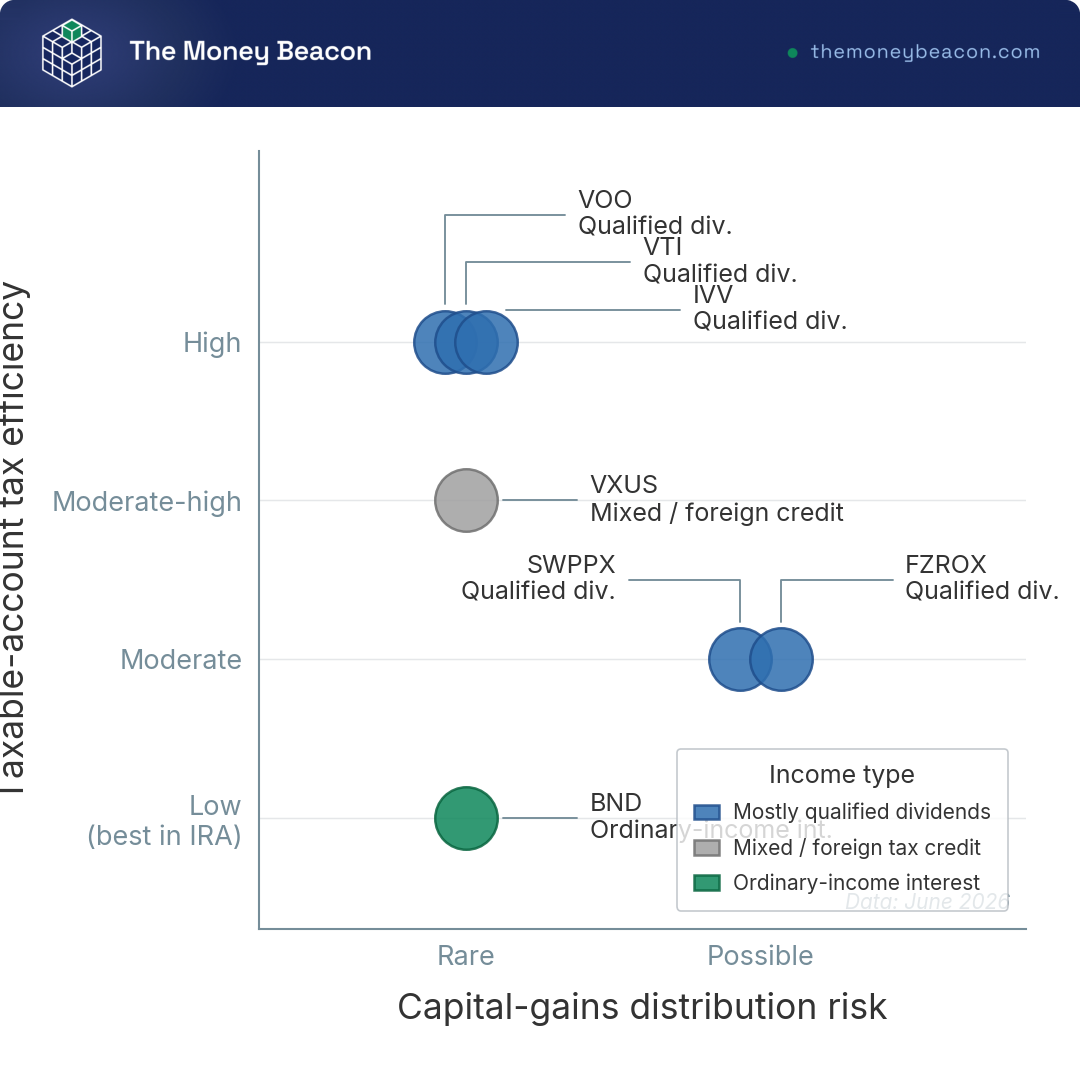
There is one rule that ties this all together: Wrapper tax efficiency only matters in a taxable account. Once your modified adjusted gross income (MAGI) surpasses $200,000 for single filers or $250,000 for married couples filing jointly, the net investment income tax (NIIT) adds an additional 3.8%, raising the top combined federal rate on long-term gains to 23.8%. However, inside a Roth IRA, where qualified withdrawals are tax-free, none of that applies. Therefore, in a Roth IRA, the wrapper choice is tax-neutral, and you simply pick based on cost.
9.5 The income each fund throws off
The difference in yield is where the funds diverge most visibly, and where a simple number can be misleading. At first glance, BND’s 4.50% yield seems like a win compared to the equity funds’ 1.00% to 2.36% yield. However, it’s important to remember what kind of income it is.
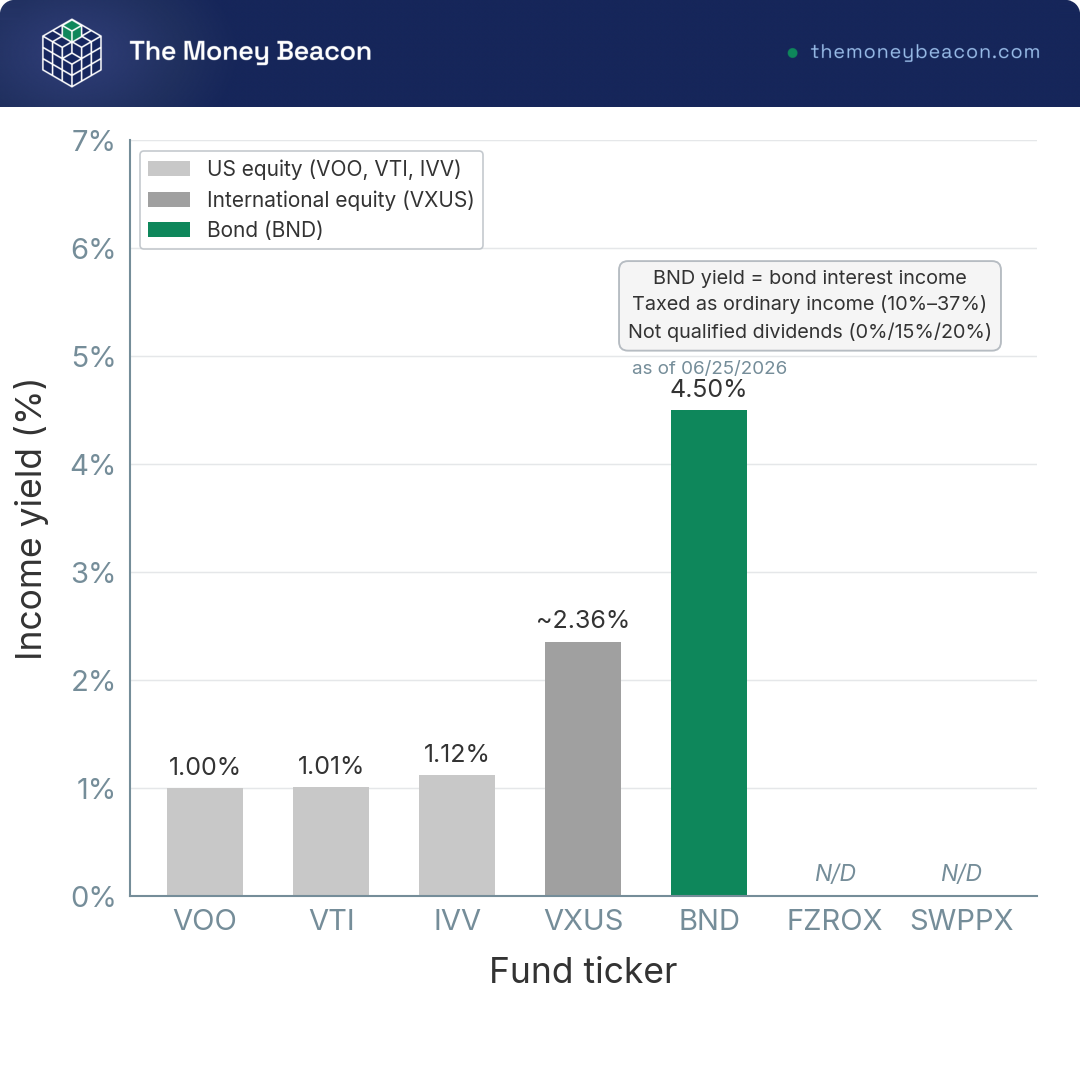
That 4.50% is bond interest taxed as ordinary income, not the qualified dividends the equity funds pay at long-term rates. So income type, not just the headline yield, is what decides where a fund belongs.
9.6 Does the wrapper change your taxes? A quick decision route
It’s easier to understand the tax implications if you reason by account first. In an IRA or 401(k), the wrapper is tax-neutral, so pick purely on cost and availability, and FZROX at 0.00% is perfectly fine. In a taxable account, favor an ETF for equity (VOO, VTI, IVV), and keep BND in a tax-advantaged account because its interest is ordinary income.
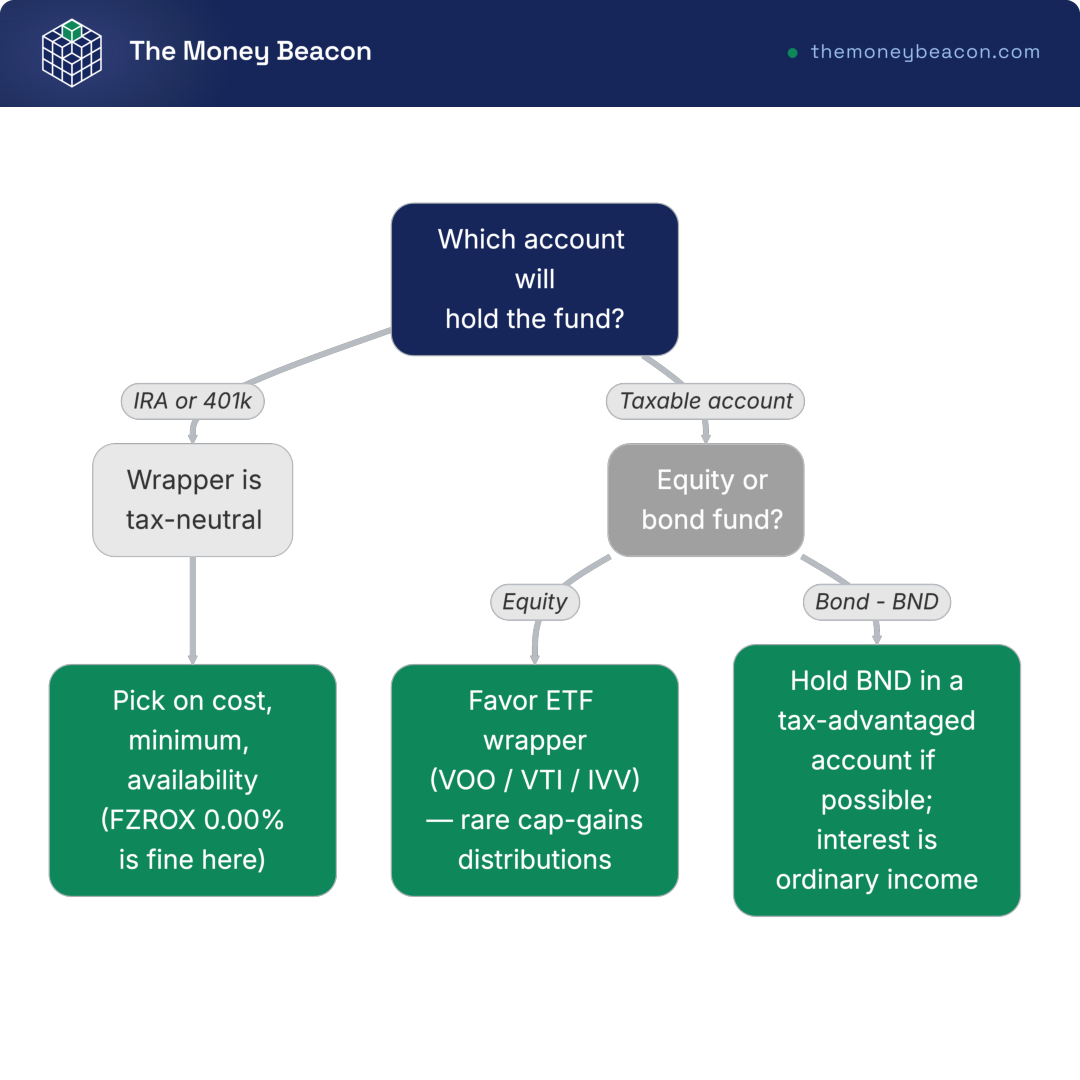
Get the account right and the wrapper choice mostly answers itself. It’s the same fork that’s worth planning around in your broader retirement savings plan.
9.7 Building a three-fund portfolio from these funds
Now that cost, tax, and income have been settled, the funds stop being a list and start being a kit you can assemble. A classic three-fund portfolio consists of 60% VTI, 20% VXUS, and 20% BND. The US-stock portion can be replaced with FZROX or any S&P 500 fund.
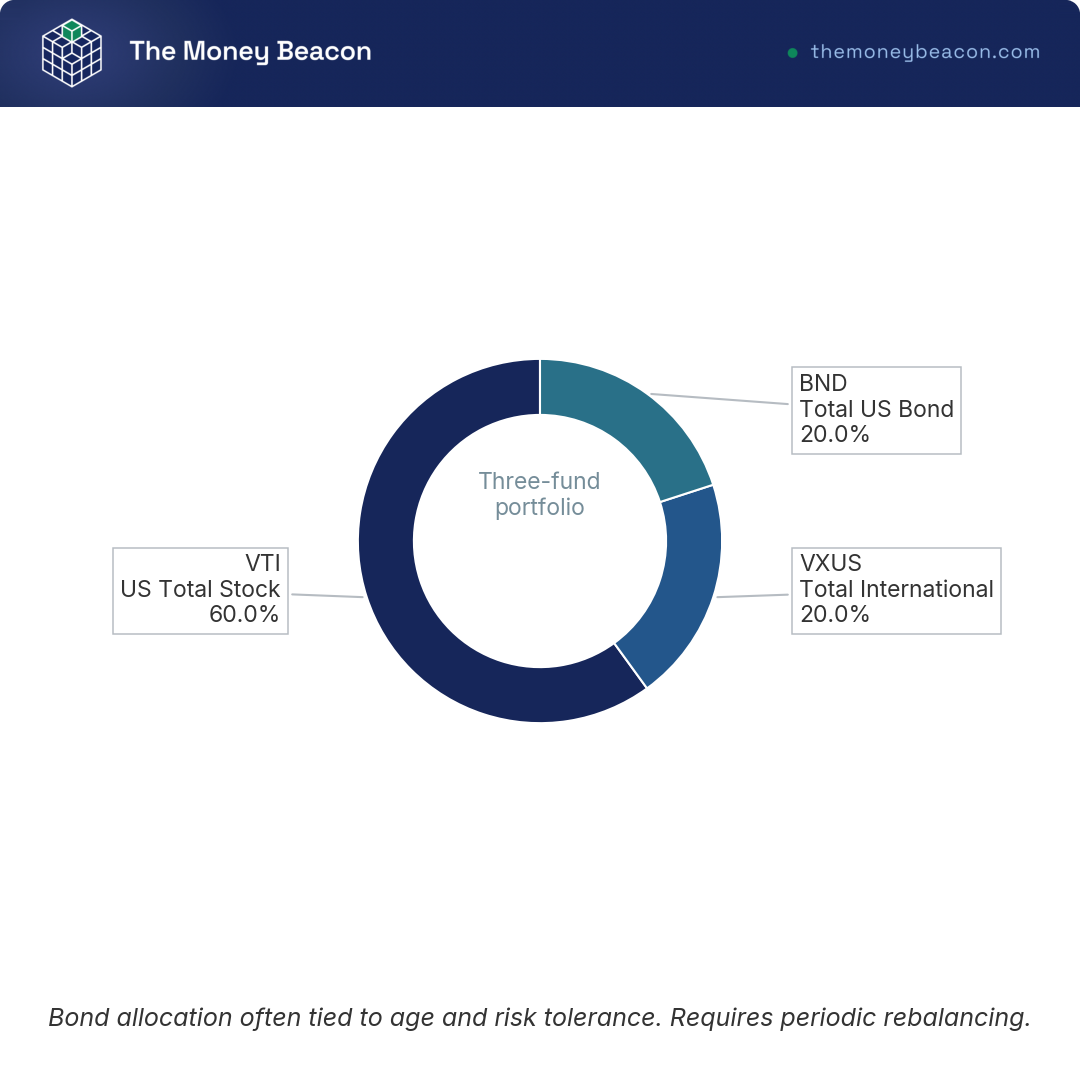
The bond share typically fluctuates with age and risk tolerance, rising as your horizon shortens, so that the entire portfolio needs periodic rebalancing to remain close to its targets. That is the core idea behind allocating your money across goals and time horizons rather than betting it all on one slice of the market.
9.8 What the international leg actually holds
The international slice is the one that most readers feel least sure about. VXUS is divided roughly into 74% developed markets and 26% emerging markets across more than 8,000 non-US stocks.
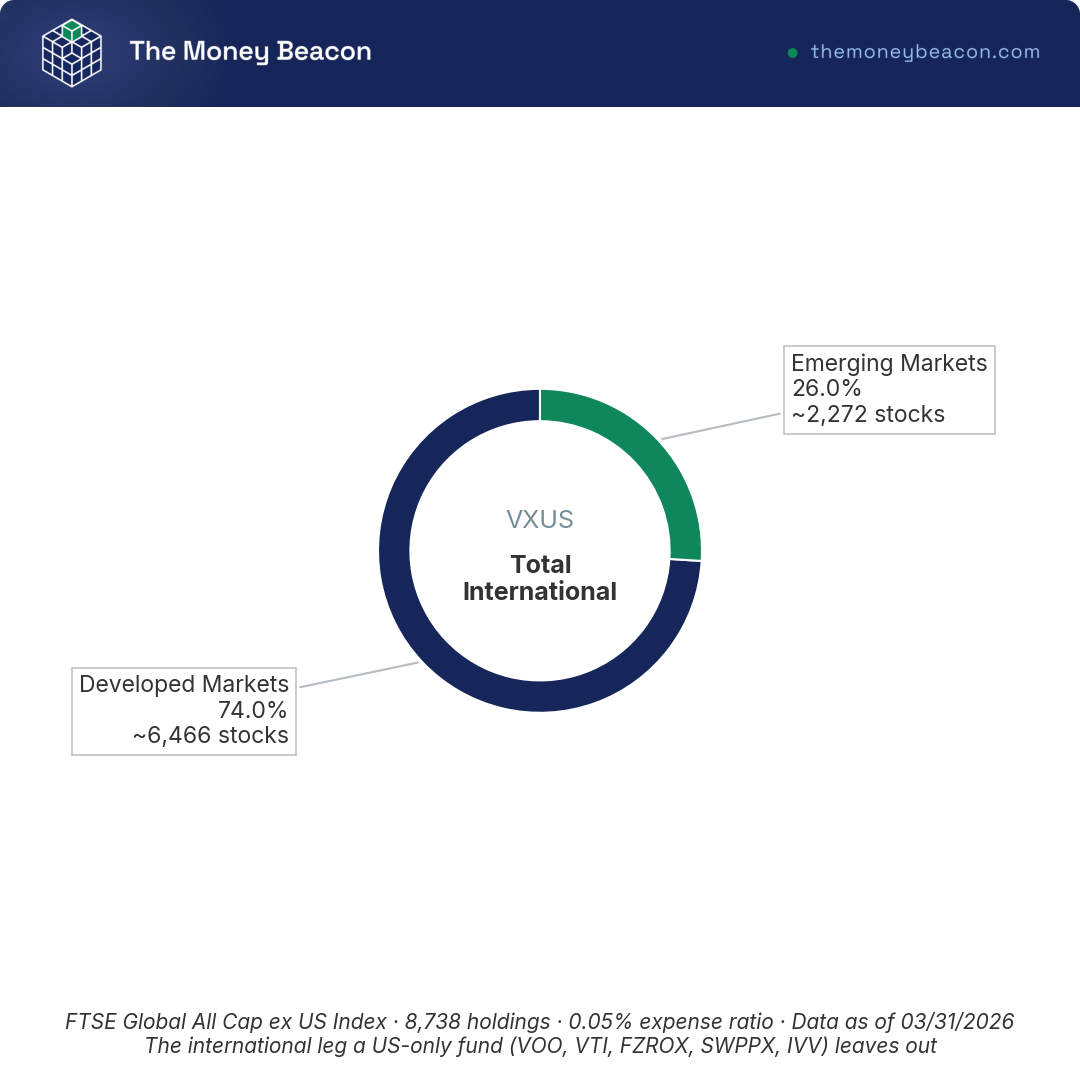
Seeing the split in one view lets you judge whether you are comfortable having about a quarter of your international funds in emerging markets or if that level of volatility is too high for you.
9.9 Verdict by reader profile
So which fund wins for you? Rather than a generic ranking, match yourself to one of the three profiles that drove this whole comparison.
Verdict: which fund wins by profile
| Reader profile | Best fit | Why |
|---|---|---|
| The one-fund beginner | VTI (or FZROX in a Fidelity IRA) | The whole US market in one transferable ticker; one decision, broad exposure |
| The three-fund-portfolio builder | VTI + VXUS + BND, rebalanced | US stock growth engine, international diversification, and bond ballast in one kit |
| The taxable-account tax-efficiency seeker | VOO / VTI / IVV equity, plus BND in an IRA | ETF wrapper for rare cap-gains distributions; shelter BND’s ordinary-income interest |
Data current as of June 2026.
Tom’s take
Once you’re running a multi-asset portfolio, the international leg stops feeling optional. A significant slice of my equity money sits in international index ETFs on purpose, because owning the rest of the world is cheap insurance against betting everything on one country, and rebalancing into the leg that lagged is where the discipline actually pays off.
Regardless of which profile fits you, two things matter more than the exact ticker: Confirm that your broker offers commission-free fund trades and transfers in kind before you buy. Set up automatic dollar-amount investing rather than trying to time your entries. If picking and rebalancing funds yourself sounds like more than you want to manage, a hands-off robo-advisor will build and maintain a version of this same three-fund strategy for you.
Conclusion
After analyzing all seven funds, I’ve learned that the headline fee rarely is decisive. The range of fees, from the lowest to the highest, is about $5 per $10,000 per year, so the real levers are the wrapper and the account in which each fund is held. For most readers, VTI is sufficient in a single transferable ticker. A three-fund kit of VTI, VXUS, and BND is ideal for those seeking U.S. growth, international breadth, and a bond cushion.
What catches people off guard is that a fund’s tax bill comes from its container, not its label. ETFs only win on tax efficiency inside a taxable account as capital gains distributions are rare. Inside an IRA, the choice is tax-neutral, so the free FZROX is perfectly fine. However, BND is the one to watch because its 4.50% yield is bond interest taxed at your ordinary rate. This is why it belongs in a tax-advantaged account whenever possible.
If you want to take this further, our comparison of online brokerage accounts shows where these funds trade commission-free and which platform fits how you invest. From there, our guide to investment taxes walks through the capital-gains and dividend rules that decide which account each fund belongs in, and our article on diversifying your savings across goals and time horizons picks up where the three-fund strategy leaves off.
FAQ: Index funds and ETFs
What is the difference between an index fund and an ETF, and does it affect my taxes?
When I lined these seven up, the wrapper turned out to matter more than most beginners expect. An index ETF like VOO, VTI, IVV, BND, or VXUS trades intraday at a market price, and thanks to in-kind redemption under SEC Rule 6c-11, it rarely passes through capital-gains distributions. An index mutual fund like FZROX or SWPPX prices once a day at net asset value, supports native dollar-amount auto-investing, but can hand its holders a capital-gains distribution they owe tax on even if they never sold. So yes, the wrapper can affect your taxes, but only in a taxable brokerage account. Inside a Roth IRA, a traditional IRA, or a 401(k), those distributions aren’t currently taxable, so the wrapper is tax-neutral and the choice comes down to cost, minimums, and where you can buy it. If you want to go deeper on how these gains are taxed, I walk through it in our investment taxes guide.
Are zero-expense-ratio funds like FZROX really free, and what’s the catch?
FZROX really does charge 0.00% in management fees, and it has no minimum, so the fee genuinely is zero. That part isn’t a gimmick. The catch is structural, not a hidden cost line. FZROX is proprietary to Fidelity and can’t be transferred in kind, so the day you want to leave Fidelity you have to sell, and in a taxable account that sale is a taxable event. On top of that, it’s a conventional mutual fund, so it can pass through capital-gains distributions the way any mutual fund can. That’s why I treat it as most attractive held inside a Fidelity IRA, where neither catch bites: you’re not leaving in a hurry, and the distributions aren’t taxable in that wrapper. Put simply, “zero expense ratio” is not the same as “free of consequences.”
Do I need an international fund like VXUS, or is a total US market fund enough?
A total US fund like VTI or FZROX is a complete US equity holding, but by definition it owns zero non-US stocks. VXUS fills that gap, adding more than 8,000 international companies across developed and emerging markets, which cuts your single-country concentration risk. It isn’t required, and I want to be honest that US-only portfolios have done well historically, so this is educational framing rather than a promise. Still, adding international is the standard way to diversify globally, and in a taxable account VXUS may even pass through a foreign tax credit. The trade-off is real: you take on currency risk, and international can lag the US for long stretches, so past performance doesn’t guarantee what comes next. If you want the simplest diversified core, layering VTI, VXUS, and BND and rebalancing now and then is the classic three-fund approach.
Which of these funds are the most tax-efficient for a taxable brokerage account?
In a taxable account, the equity ETFs win on tax efficiency. VOO, VTI, and IVV combine the ETF structure with dividends that are mostly qualified, taxed at the long-term capital-gains rates rather than ordinary income. VXUS is reasonably efficient too, and it can hand back a foreign tax credit that offsets some foreign withholding. BND is the outlier here: its distributions are ordinary-income interest, taxed at your marginal rate, which makes it the least tax-efficient of the seven, so I keep it in an IRA or 401(k) whenever I can. The two mutual funds, FZROX and SWPPX, are slightly less efficient than equivalent ETFs because they can throw off capital-gains distributions. One thing worth remembering: none of this matters inside a Roth IRA or other sheltered account, where the wrapper is tax-neutral.
How much does the expense ratio actually cost me per $10,000 invested?
The math here is refreshingly simple: multiply the expense ratio by your balance. On $10,000, FZROX costs you $0 a year, SWPPX runs about $2, VOO, VTI, IVV, and BND cost roughly $3 each, and VXUS lands around $5. So the gap between the cheapest and the most expensive fund in this comparison is about $5 a year per $10,000. That’s real money, and I’m not going to pretend it’s nothing, but it’s small next to the decisions that actually drive your long-run outcome, namely your tax placement and your behavior. Picking the right account for each fund, and not panic-selling, matters far more than shaving that last dollar or two off the expense ratio. If you’re just getting started, our guide to investing in the stock market shows why these low-cost funds beat most active managers in the first place.




Comments
Questions and corrections welcome. We read everything.