


Right now you probably have a few thousand dollars parked in checking or a savings account paying almost nothing. It feels safe. It is not. With inflation running around 3%, $10,000 sitting in a 0.5% account quietly loses about $250 of purchasing power every year while you sleep. Do that for a decade and you have handed over the price of a decent used car for the privilege of “not taking any risk.”
So you think about the stock market, and then you stop. It looks like a casino run by people in better suits than yours, full of jargon, ticker symbols, and headlines that scream “buy everything” one morning and “sell everything” the next. You do not know how much you need to start, which account to open, or how to avoid being the sucker who buys high and panic-sells low. So the money stays in checking, losing a little more ground every month.
Here is the part nobody tells you: the boring approach has quietly beaten most of the professionals. Over the long run, the overwhelming majority of full-time fund managers paid to beat the S&P 500 fail to do it, and the index still eats their lunch. You do not need to outsmart them. You just need to own the whole market cheaply and then leave it alone.
And 2026 is a genuinely good year to start. The major brokers charge $0 commissions, plenty have no account minimum, and you can buy a fraction of a fund for as little as $1. The 2026 IRA (individual retirement account) limit is $7,500, and the cost of getting in the door has basically dropped to nothing. The only thing standing between you and a funded, diversified portfolio is knowing the steps.
1. What the Stock Market Actually Is and How It Pays You
Before you open or buy anything, it is worth settling what you are actually buying when you put money into the stock market, and where the money you make comes from.
1.1 Shares, ownership, and why you do not need to pick companies
A share of stock is a fractional ownership claim on a real company, its buildings, its cash, its brand, and its future profits. Own one share and you own a proportional slice of those earnings, paid to you as dividends or kept inside the business to grow it, and you usually get a vote too. A share is not a lottery ticket or a chip on a table; it is a tiny piece of an actual business that sells things and (you hope) makes money doing it.
Those shares change hands on exchanges, the marketplaces where buyers and sellers meet. In the US the two big venues are the New York Stock Exchange, owned by Intercontinental Exchange (ICE), and the Nasdaq, run by Nasdaq, Inc. You do not need to understand the plumbing of either one to use them.
Here is the part that takes the pressure off. You do not need to figure out which single company will win. Buy a broad fund and you own a sliver of thousands of companies at once, so no single bad pick can sink you. That reframing, owning the whole basket instead of betting on one name, is the foundation of everything in this guide.
1.2 Indexes and the S&P 500: what you are really buying
If a single share is one slice, an index is the recipe for the whole basket: a rules-based list of stocks that tracks a defined slice of the market, rebuilt on a published schedule so nobody is picking favorites by hand.
The most famous one is the S&P 500, which tracks about 500 large US companies (503 constituents as of mid-2026, because a handful of companies have more than one share class) chosen by S&P Dow Jones Indices. Buy a fund that follows it and you own a piece of the biggest names in the American economy in one go. Go broader and a “total US stock market” index tracks roughly 3,500 to 4,000 US companies of every size, from the giants down to the small caps. That is the gap between owning the headline names and owning nearly everything that trades.
So when you ask “what is the S&P 500,” the honest answer is a pre-built portfolio of America’s largest public companies, weighted by size. The donut below shows how that breaks down across the 11 sectors the index is sorted into.
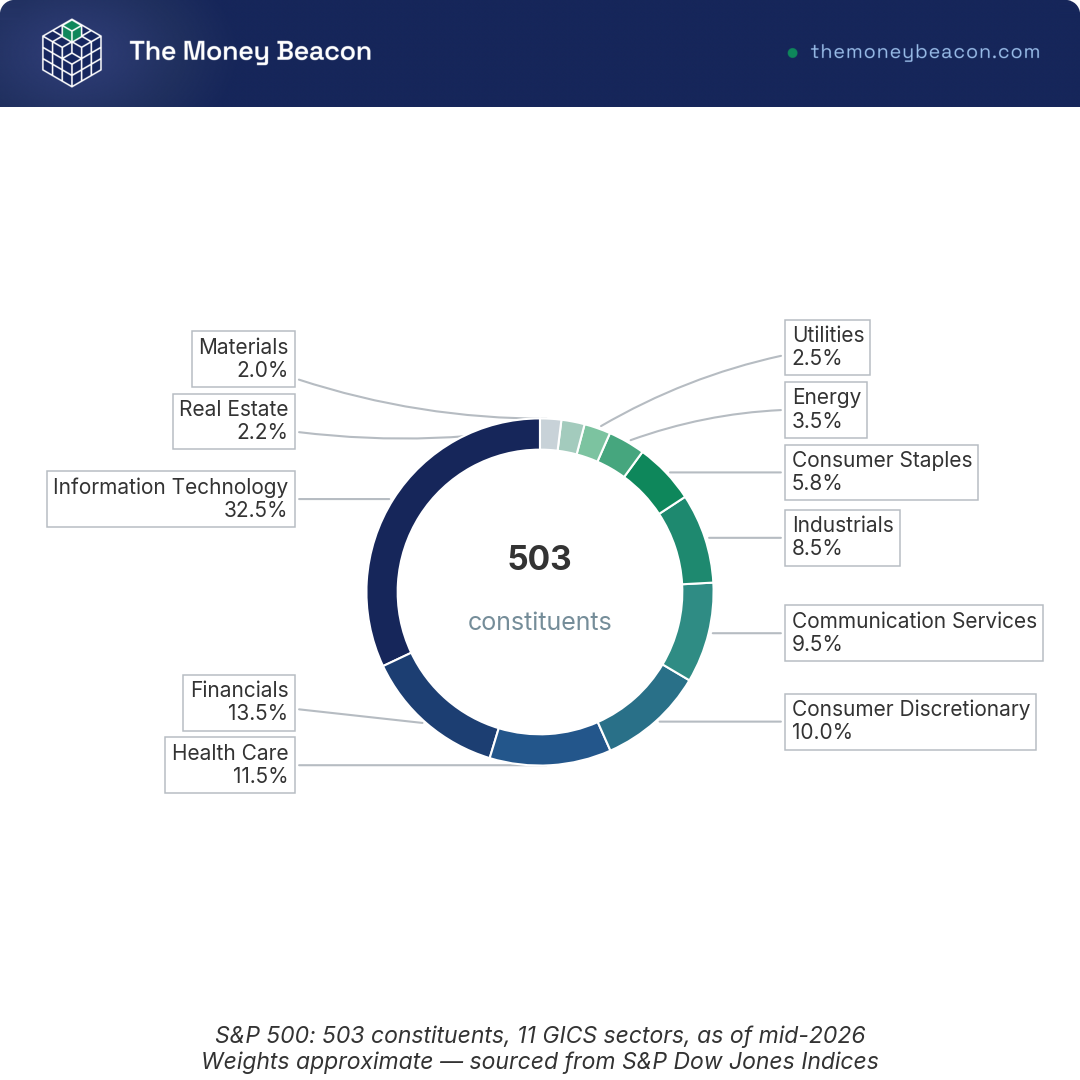
The weighting leans heavily toward information technology, so you are diversified across 500 companies but not evenly spread. That tilt is why some investors pair the S&P 500 with a broader total-market fund.
1.3 The two engines of return: earnings growth and reinvested dividends
You own the basket. So why does it grow? Long-run stock returns come from two engines, and it helps to consider them separately.
The first is earnings growth: companies sell more, earn more, and the prices investors will pay for those earnings rise along with them. The second is dividends, the cash companies hand back to shareholders out of profits, which historically supplied a meaningful share of total return when plowed back in. Reinvesting them automatically, through a dividend reinvestment plan (a DRIP), turns each payout into more shares that then earn their own dividends. That is compounding doing its quiet work in the background.
This is why total return, the price change plus reinvested dividends, is the number that matters, not the price chart alone. A stock that barely moves on price but pays and reinvests a steady dividend can still build real wealth. Over the long run the US market has delivered roughly 10% nominal and about 7% after inflation, annualized; a live total-return proxy for the 30 years ending December 31, 2025 came in around 10.4%. Those are averages across decades, not a promise for any year, and past performance does not guarantee future results.
Put $500 a month into a diversified stock fund for 30 years at a 7% average annual return, compounding monthly, and you end up with about $610,000, of which only about $180,000 is money you actually contributed. The other ~$430,000 is compounding. You did not earn it at work; your earlier dollars earned it for you.
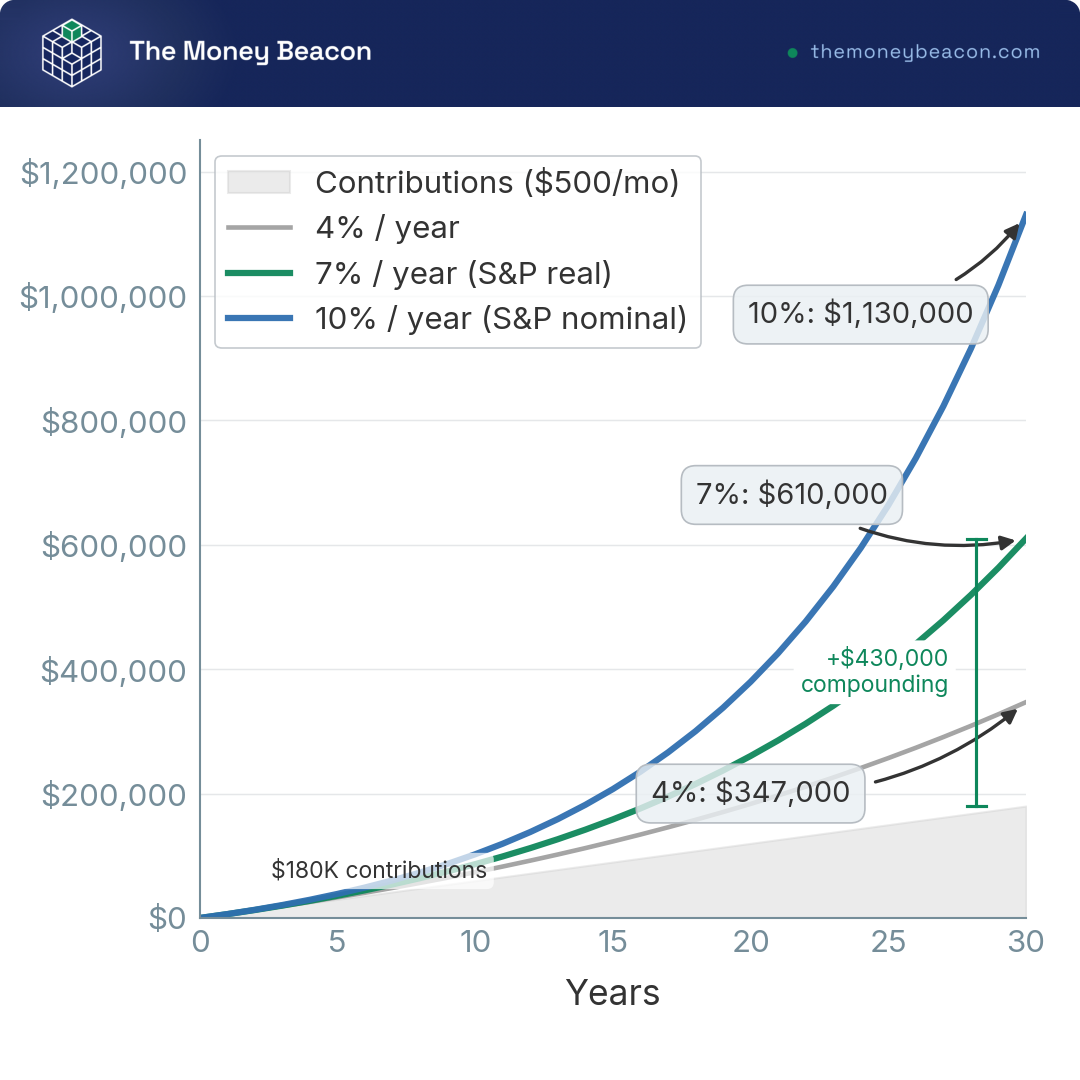
The catch is that the line is never as smooth as the chart makes it look.
1.4 Risk, volatility, and the five-year rule
Prices move every day, sometimes hard, on earnings news, on interest-rate expectations shaped by the Federal Reserve, and on plain sentiment. That movement is called volatility, and the most useful thing you can do is stop treating it as a defect. Volatility is the price of admission for long-run returns, not a malfunction. Stocks have paid more than cash over time precisely because they make you sit through the bumps.
And the bumps are real. Historically the US market has had a down year roughly one in four years, and a decline of 20% or more, a bear market, has shown up about once every eight to ten years. Yet given enough time it has recovered each one and gone on to new highs. The behavioral rule that falls out of this is simple: money you will need within about five years does not belong in stocks. A 30% drawdown is a temporary dip when you have 20 years ahead of you; it is a disaster when the tuition bill or the down payment is due next spring.
| Time horizon | Historical risk of loss in stocks | Practical implication |
|---|---|---|
| < 1 year | High; double-digit losses common | Do not use stocks; use HYSA/MMF |
| 1-5 years | Meaningful; recovery not assured | Mostly cash/short bonds |
| 5-10 years | Lower; most periods positive | Mixed stock/bond |
| 10+ years | Low historically; no guarantee | Stock-heavy reasonable |
Data current as of June 2026.
The table draws the line for you. Cash you might touch inside a year has no business in the market; park it in a top-rated FDIC-insured high-yield savings account instead, where the value does not move. Money you will not touch for a decade or more can ride the swings, because time is what turns volatility from a threat into a feature.
You now know what you own, why it grows, and why it lurches around on the way up. That raises the only question that matters next: what is the smartest, cheapest way to own that whole basket, and is it worth paying a professional to try to beat it?
2. Index Funds vs. Stock-Picking: Why Boring Wins
You already know an index is a rules-based list of stocks. The product built on that idea is what you will actually buy, and it has quietly humbled most of the highly paid people who try to beat it. So what is the smartest way to own the market, and does spending more to “do better” ever pay off?
2.1 What an index fund and an ETF actually are
An index fund mechanically holds every stock in an index, in proportion, instead of trying to outguess it. No star manager, no hot picks, just “own the list.” It comes in two formats that trip people up far more than they should.
An ETF, an exchange-traded fund, trades intraday on an exchange like a single stock; you can buy it any time the market is open, with a market or limit order. An index mutual fund instead prices once per day, after the close, at its net asset value (NAV), the per-share value of everything it holds. Here is the crucial point: both can track the exact same index at nearly identical cost. The differences are practical, not philosophical.
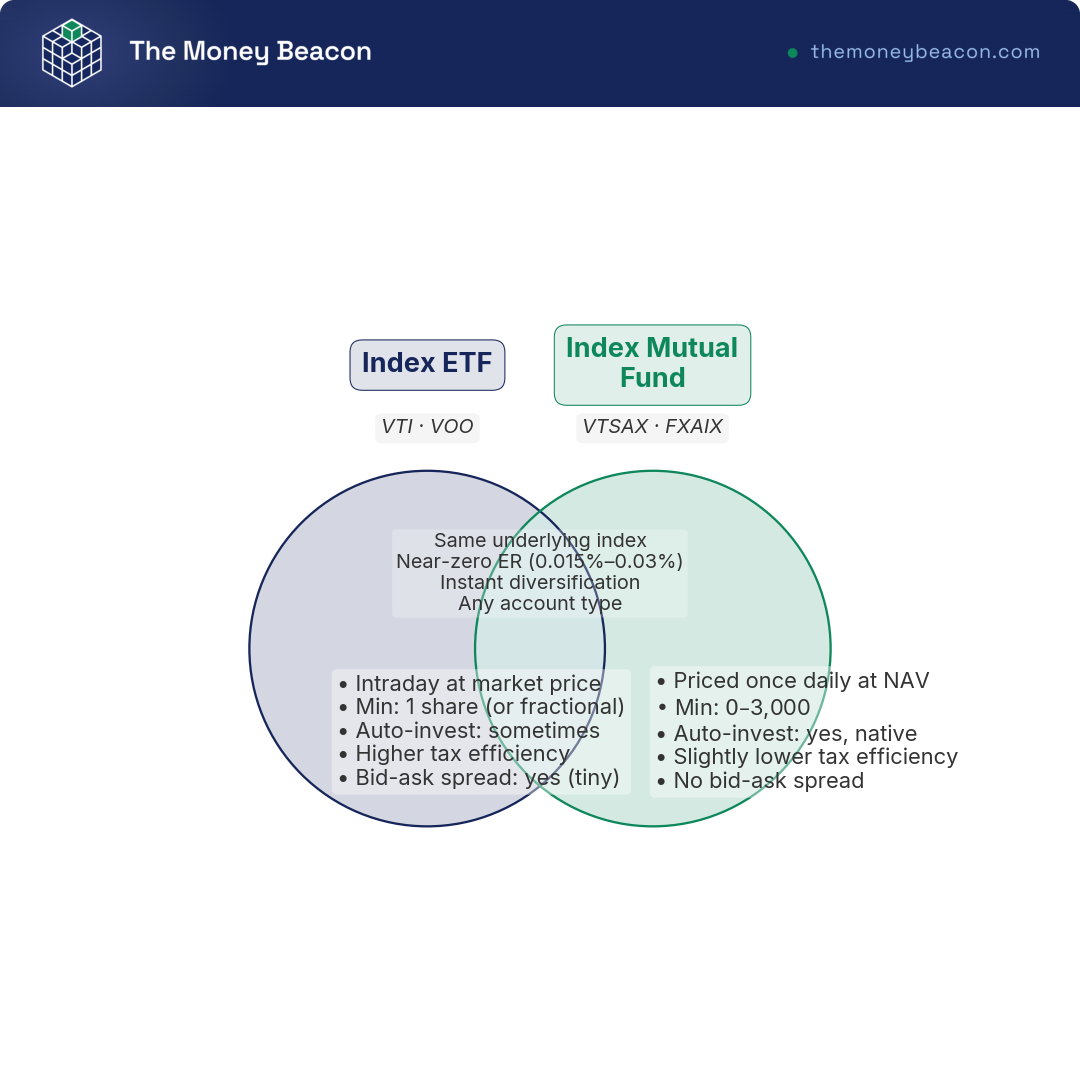
| Feature | Index ETF (e.g., VTI, VOO) | Index mutual fund (e.g., VTSAX, FXAIX) |
|---|---|---|
| How you buy | Intraday at market price; market or limit order | Once daily at NAV; dollar amount |
| Minimum | Price of 1 share (or fractional, broker-dependent) | $0-$3,000 depending on fund (VTSAX $3,000; some Fidelity index funds $0; Schwab index funds commonly $1) |
| Auto-invest fixed $ | Sometimes (fractional needed) | Yes, native |
| Tax efficiency (taxable acct) | Generally higher | Slightly lower (capital-gains distributions) |
| Bid-ask spread | Yes (tiny for broad ETFs) | None |
Data current as of June 2026.
For automatic monthly investing the deciding factors are narrow: a mutual fund lets you auto-invest a flat dollar amount natively, while an ETF gives you intraday trading and (usually) fractional shares but carries a tiny bid-ask spread, the small gap between the buy and sell price. For a broad fund that spread is trivial. Either format works, and we walk through the trade-offs in our comparison of the best low-cost index funds and ETFs for US investors.
2.2 The SPIVA evidence: do the pros actually beat the index?
The headline from the introduction comes from the SPIVA U.S. Scorecard, published twice a year by S&P Dow Jones Indices, and the fuller picture is even less flattering.
Through December 31, 2025, roughly 86% of active US large-cap funds underperformed the S&P 500 over 10 years, and about 90% fell short over 15 years. The odds get worse, not better, the longer you measure. And those numbers actually flatter the active crowd, because of survivorship bias: the worst funds get quietly closed or merged away and drop out of the long-run scorecard, so the failure rate you see understates the real one.
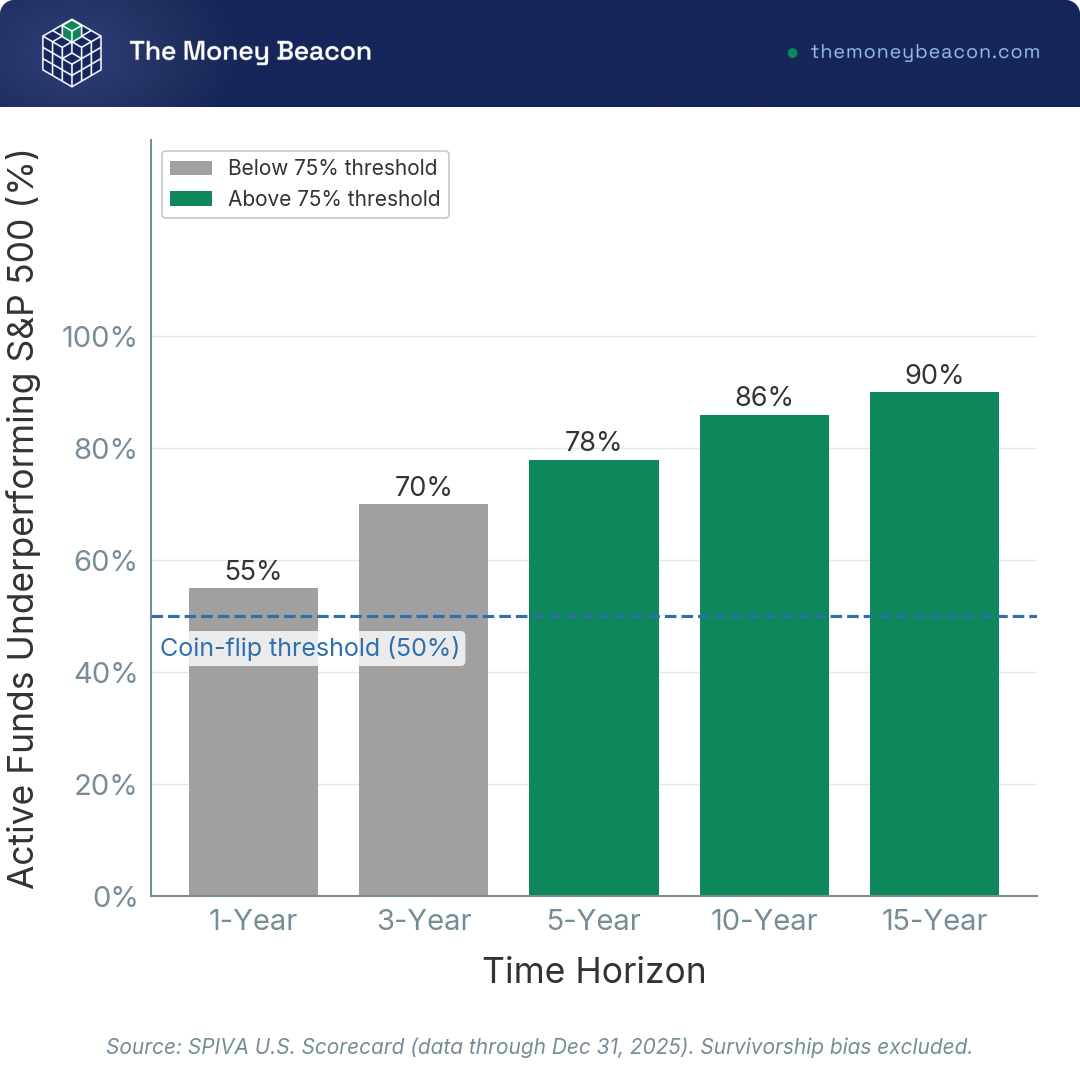
The lesson is not that professionals are stupid; they are smart, well-funded, and still mostly lose to the index after fees. Picking the rare winning fund or stock in advance has lousy odds. Owning the whole market guarantees you the market’s return minus a fee that, as you are about to see, can be almost nothing.
2.3 How fees and expense ratios quietly compound against you
If picking winners is a losing game, what does the losing ticket cost? The answer is the expense ratio, the annual percentage a fund skims off the top, deducted so silently you never see a bill. Active funds often layer on more: loads, which are front- or back-end sales commissions, and higher turnover that drags on returns.
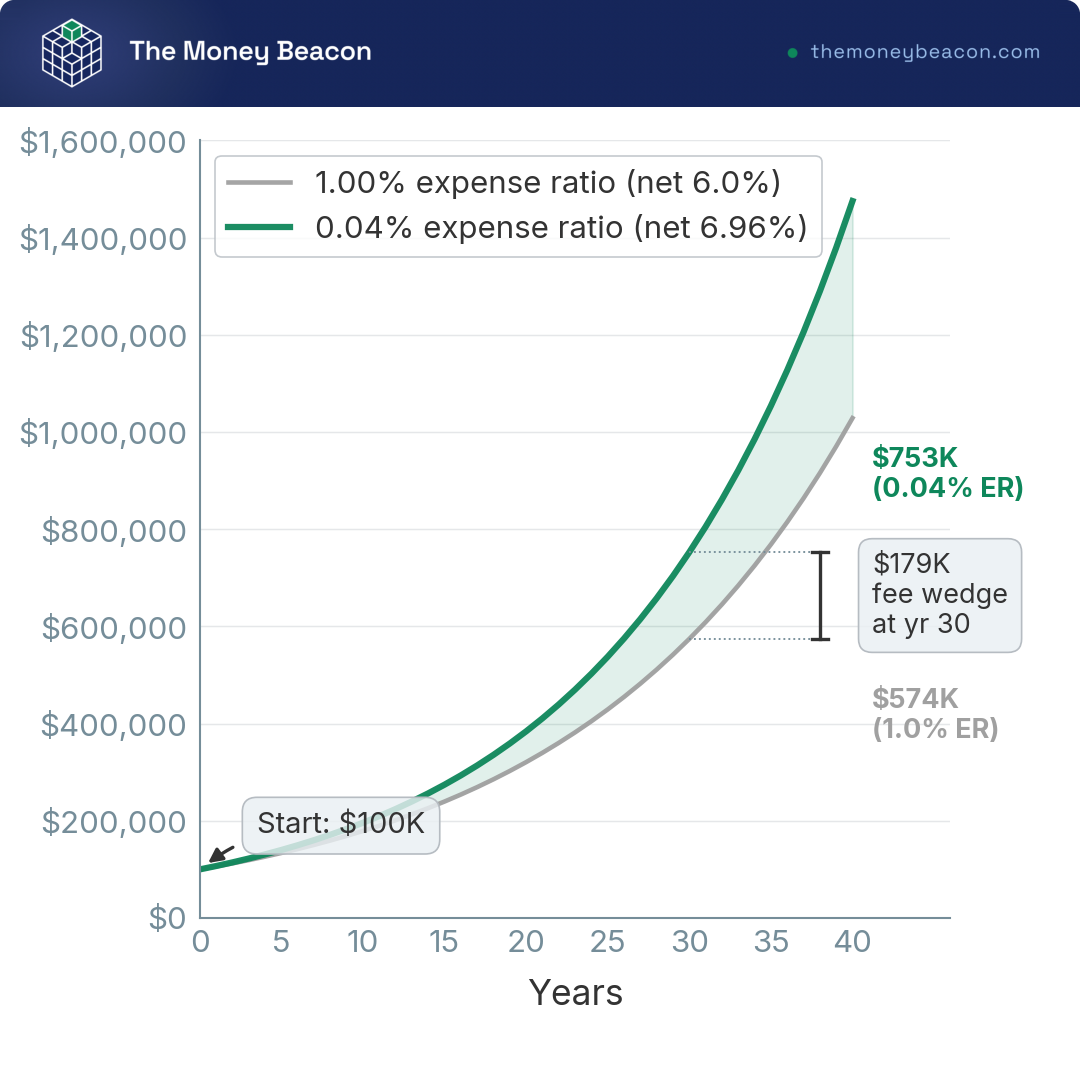
Here is the trap. A 1% annual fee does not “cost 1%.” Over decades it can quietly eat 20% to 30% of your final balance, because every dollar taken in fees is also a dollar that never compounds.
Watch what that does to real money. Put $100,000 to work at a 7% gross return for 30 years. At a 0.04% expense ratio you end with about $753,000. At a 1.0% expense ratio, same investment, same market, you end with about $574,000. The fund company kept roughly $179,000 of your money for the privilege of, on average, trailing the index.
| Cost item | Low-cost index investor | Typical active investor |
|---|---|---|
| Stock/ETF trade commission | $0 (US online brokers: Vanguard, Fidelity, Schwab, Robinhood) | $0 |
| Fund expense ratio | 0.015%-0.04% | ~0.65% average (0.5%-1.0%+) |
| Sales load | None | 2%-5.75% on some load funds |
| Account/inactivity fee | Commonly $0 at major brokers | Varies |
| Bid-ask spread (ETF) | Tiny on broad ETFs | n/a for mutual funds |
Data current as of June 2026.
Tom’s take

I’ve shopped most of the big private banks for the active side of my portfolio, and the lesson keeps repeating: almost nobody beats a cheap index fund consistently after you count the fee, so I refuse to pay up for the story. Make them justify every basis point, or own the market for next to nothing.
2.4 When (if ever) picking individual stocks makes sense
So is there ever a place for buying a single company you believe in? For most beginners, never as the core. The official investor-education sources, Investor.gov and FINRA, set no universal percentage cap and steer you toward diversification and rebalancing over any magic number.
The compromise a lot of seasoned investors land on is a small “play money” sleeve, often no more than 5% to 10% of the portfolio, walled off entirely from your index-fund core. If a single pick blows up, it stings, but it cannot derail the plan. Scratch the stock-picking itch with money you can afford to be wrong about, and keep the engine of your wealth in the boring, diversified core.
The cheap, diversified core matters far more to your result than any single hero pick ever will. If active trading tempts you beyond a small sleeve, our look at the real risks of active trading and why most people should stick to investing is worth reading first. For a beginner, the answer is settled, so the only practical question left is where to hold all this and which account to open first.
3. Choosing a Brokerage and the Right Account
You know what to buy: a broad, low-cost index fund. So where do you actually hold it, and which account deserves your first dollar? This is where investing stops being theory and turns into clicks. We start with how to pick a broker and how your money is (and is not) protected, then untangle the single confusion that trips up nearly every beginner.
3.1 What to look for in a broker, and how your money is protected
So what does a good beginner broker look like? The checklist is short: $0 commissions, low-cost in-house index funds, no account minimum, fractional shares, easy bank linking and automatic investing, a usable app, and customer service you can actually reach. All US broker-dealers must register with the SEC (the Securities and Exchange Commission) and answer to FINRA (the Financial Industry Regulatory Authority), and you can verify any firm or adviser yourself, free, on FINRA BrokerCheck before you hand over a dollar.
The big beginner-friendly brokers cluster tightly on price, so you are mostly choosing on the in-house funds and the auto-invest experience rather than on cost.
| Broker | Commission (online stocks/ETFs) | Account minimum | Fractional shares | Notable for beginners |
|---|---|---|---|---|
| Fidelity | $0 | $0 | Yes (from $1) | $0-minimum index mutual funds; native fixed-dollar auto-invest |
| Charles Schwab | $0 | $0 | Yes (S&P 500 “Stock Slices”) | Low-cost index funds (SWPPX 0.02%); no maintenance fee |
| Vanguard | $0 | $0 | Limited (Vanguard ETFs) | Originator of low-cost index funds (VTI/VOO 0.03%) |
| Robinhood | $0 | $0 | Yes | Simple app; fewer in-house funds, no index mutual funds |
Data current as of June 2026.
Any of the four gets you invested today at zero cost, so the tiebreakers are small: Fidelity and Schwab lead on cheap in-house index funds and clean automatic investing, Vanguard is the originator of the whole low-cost movement, and Robinhood wins on a simple app but offers no index mutual funds. We go deeper in our full comparison of the best online brokerage accounts for US investors.
Now to the safety point many get wrong. A brokerage account is not FDIC-insured. Bank and credit-union deposits are insured by the FDIC (the Federal Deposit Insurance Corporation, for banks) or the NCUA (the National Credit Union Administration, for credit unions) up to $250,000 per depositor, per institution, per ownership category. Brokerage securities and cash are protected instead by SIPC, up to $500,000 per customer including a $250,000 cash limit, but only if the brokerage firm itself fails. Neither one reimburses you for market losses. If your index fund drops 30% in a crash, no insurance backstops it; that is normal market risk, which is why the emergency fund stays in a bank.
3.2 The confusion that trips up every beginner: account vs. asset class
Here is the mistake you see constantly: “Should I get a Roth IRA or an index fund?” It feels like a real question, but it is a category error, like asking whether to buy a wallet or some cash. An account is a tax wrapper; an asset class is what you hold inside it. You open a Roth IRA and then buy the index fund inside it. They are not alternatives; they are two layers of the same decision.
| Level | Examples | What it determines |
|---|---|---|
| Accounts (tax wrappers) | Taxable brokerage, Traditional IRA, Roth IRA, 401(k)/403(b)/457, HSA, 529, HYSA, CD | How the money is taxed; contribution limits; withdrawal rules |
| Asset classes / vehicles | Stocks, bonds, index funds, ETFs, mutual funds, money market funds, REITs, Treasurys, crypto | The risk/return and growth of the money |
Separate the two cleanly and how to start investing stops being a riddle: you pick the wrapper, then fill it with the fund. Which raises the follow-up, since you cannot fill every wrapper at once: which one first?
3.3 The funding waterfall: which account to fill first
Money flows best in a fixed order, the “investing waterfall,” where each tier fills before the next gets a drop.
First, pay off high-interest debt. The average credit-card APR (annual percentage rate) sat around 21% in early 2026, and clearing it is a guaranteed, tax-free ~21% return you will not beat reliably anywhere in the market; treat anything above roughly 8% to 10% APR as the best “investment” on the board. Second, build a 3-to-6-month emergency fund in a high-yield savings account or money market fund, so a job loss never forces you to sell stocks at the bottom.
Third, capture the full employer 401(k) match. A common formula is 50% on the first 6% of pay; a common safe-harbor version is 100% on the first 3% plus 50% on the next 2%. Either way it is an instant 50% to 100% return on the matched dollars, free money you should never leave on the table. Fourth, fund an IRA, Roth if you are eligible, to the annual limit. Fifth, return to the 401(k) and fill it to the elective-deferral limit. Sixth, anything beyond that goes into a taxable brokerage.
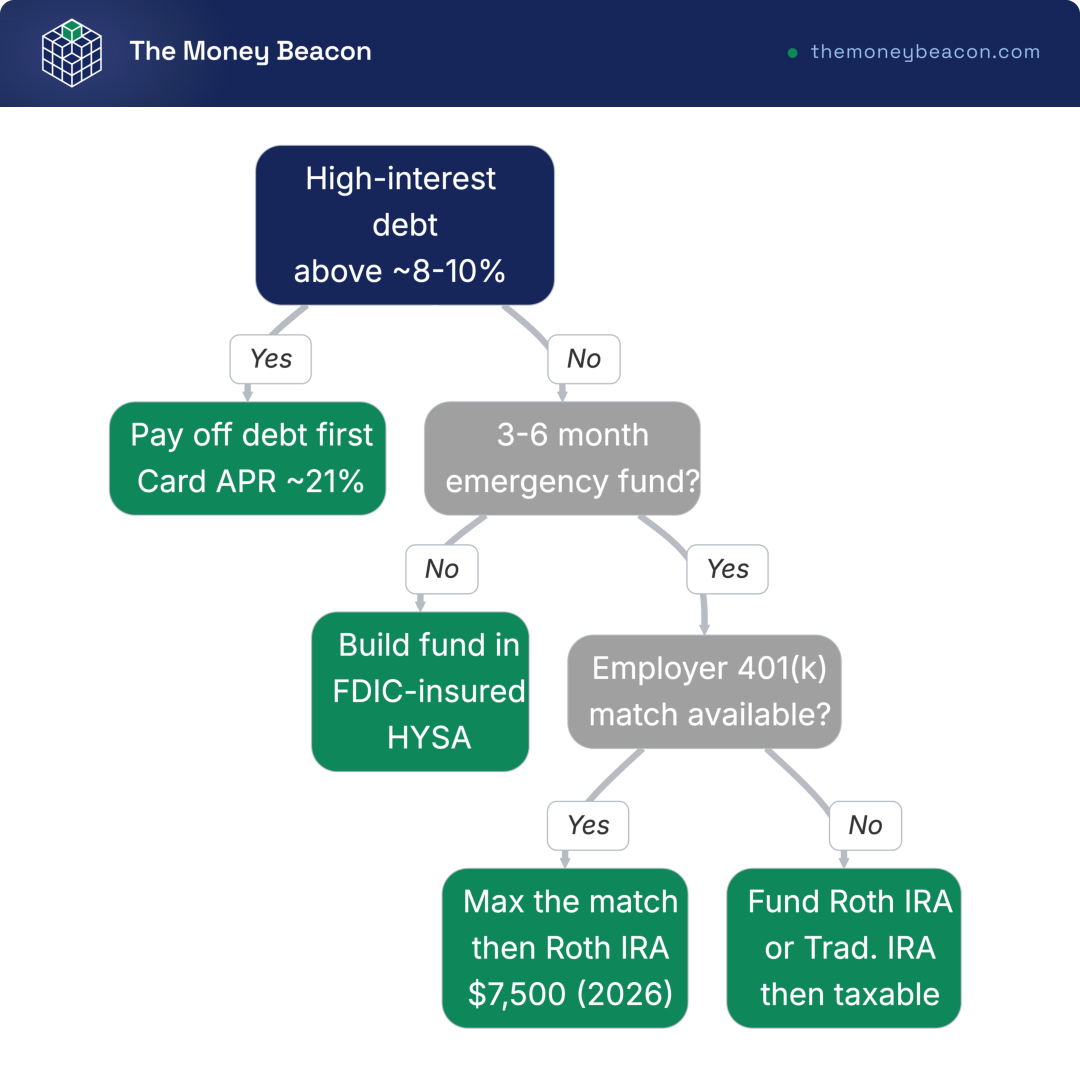
The whole question of whether to pay off debt or invest is right there at the top, and for ~21% debt the answer is not close. With the order set, the next question is which flavor of retirement account you are pouring money into.
3.4 Roth vs. Traditional vs. 401(k), income limits, and the backdoor Roth
The whole Roth-versus-Traditional decision is one bet: do you pay tax now or later? A Traditional IRA or 401(k) takes pre-tax money, lowering this year’s taxable income, and taxes withdrawals as ordinary income in retirement; it wins if you expect a lower rate later. A Roth IRA or Roth 401(k) takes after-tax money that is never deductible, but qualified withdrawals, after age 59½ and a 5-year holding period, come out completely tax-free; it wins if you expect a higher rate later, the common case for younger earners with decades of raises ahead. Here is a useful safety valve: Roth IRA contributions, though not the earnings, can be pulled back out anytime, tax- and penalty-free.
Income can take the direct Roth off the table. In 2026 the Roth IRA contribution phases out over $153,000 to $168,000 for single filers and $242,000 to $252,000 for married filing jointly ($0 to $10,000 for married filing separately). It is a phase-out, a sliding scale, not a cliff. Above the top of the range, the backdoor Roth is the legal workaround: you contribute to a nondeductible Traditional IRA, then convert it to Roth. The catch is the pro-rata rule, which blends any existing pre-tax IRA balance into the conversion and taxes it proportionally, so a big rollover IRA can make the backdoor messy.
High earners carry two more wrinkles. The 3.8% net investment income tax (NIIT) stacks on top of the long-term capital-gains rate at higher incomes (the full thresholds are in the tax section below). And under the SECURE 2.0 Roth catch-up mandate (final regulations issued September 15, 2025, effective January 1, 2026), catch-up contributions must be made as Roth for workers whose prior-year FICA wages topped the statutory $145,000 threshold, indexed for inflation. One thing worth flagging: the 401(k) is an employer plan governed by ERISA under Department of Labor oversight, while the IRA is your own account at a brokerage.
| Account (tax wrapper) | 2026 contribution limit | Tax treatment of contributions | Tax at withdrawal | Liquidity |
|---|---|---|---|---|
| Taxable brokerage | Unlimited | After-tax | Cap-gains/dividends taxed yearly + at sale | Anytime, no penalty |
| Traditional IRA | $7,500 (+$1,100 age 50+) | Pre-tax if eligible (deductible) | Ordinary income; 10% penalty if <59½ | Restricted |
| Roth IRA | $7,500 (+$1,100 age 50+) | After-tax (never deductible) | Tax-free if qualified | Contributions out anytime; gains restricted |
| 401(k)/403(b)/457 | $24,500 (+$8,000 age 50+; $11,250 ages 60-63) | Pre-tax or Roth | Depends on type; 10% penalty if <59½ | Restricted |
| HSA (HDHP only) | $4,400 self / $8,750 family (+$1,000 age 55+) | Pre-tax | Tax-free for medical; otherwise taxed | Restricted (medical) |
Data current as of June 2026.
For most young and mid-career savers the Roth IRA earns its spot first, because tax-free growth over 30 years is worth more than a small deduction today, and the contribution liquidity is a genuine backstop. Our Roth IRA guide covers every rule a beginner and high earner need to know, phase-outs and backdoor mechanics included.
Hank’s take
Roth versus Traditional looks like a math problem, but it is really a forecast about your own future tax rate, and the behavioral-finance research is blunt about how badly people predict that. What the data shows is that young earners tend to underrate their future income, so they overvalue today’s deduction; reading the phase-out as a gradient rather than a wall, and leaning Roth while your rate is low, hedges a bet you cannot actually win on certainty.
3.5 Roth, Traditional, or taxable: a decision tree (and the high-earner backdoor path)
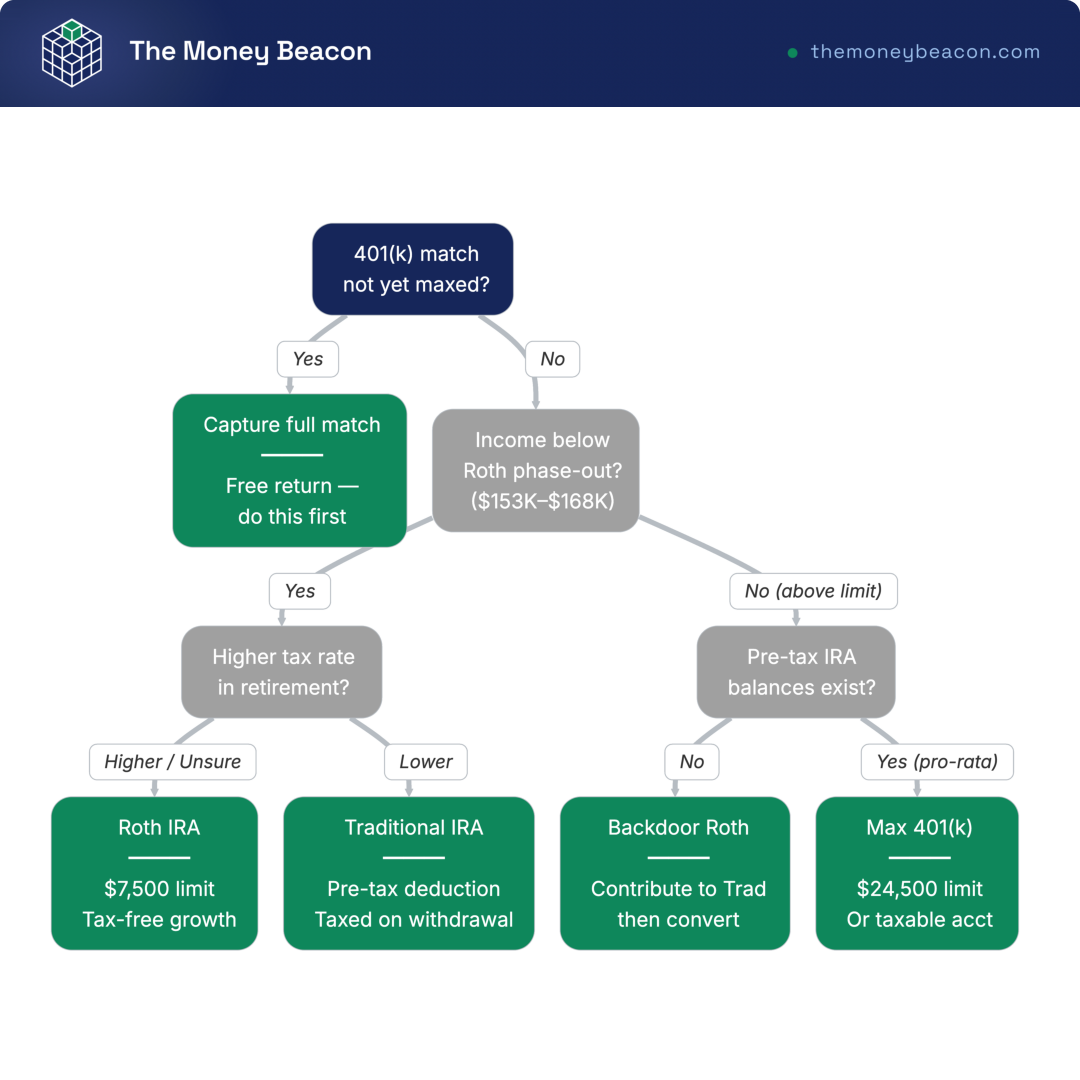
Follow it from the top: grab any unused employer match, check your income against the Roth phase-out, weigh your expected future tax rate against today’s, then account for any pre-tax IRA balance and your tolerance for the pro-rata math. A high earner above the phase-out lands on a clear branch: direct Roth is off the table, so it is a backdoor Roth (with pro-rata planning) or a maxed 401(k) and then taxable. Everyone ends at one concrete account to open.
3.6 If you are self-employed or 1099: SEP IRA and Solo 401(k)
If you are a 1099 contractor, freelancer, or small-business owner, the rules open up in your favor: you get higher-limit accounts a W-2-only employee cannot touch.
| Account (self-employed) | 2026 limit | Who it fits | Note |
|---|---|---|---|
| SEP IRA | Up to $72,000 (≤25% of net self-employment comp) | Solo earners, simple setup | Employer-side contributions only |
| Solo 401(k) | Employee $24,500 + employer share, up to $72,000 total | Solo earner wanting max + Roth option | Allows Roth + loans; catch-up $8,000 (age 50+) or $11,250 (ages 60-63) if the plan allows |
| SIMPLE IRA | $17,000 employee | Small business with employees | Lower admin; $18,100 limit for employers with ≤25 employees |
Data current as of June 2026.
The rule of thumb is short. The Solo 401(k) usually wins when you want the most tax-advantaged space plus a Roth option and the ability to borrow, while the SEP IRA wins on pure simplicity if you would rather skip the plan paperwork. Both can reach the $72,000 total defined-contribution limit for 2026; the SIMPLE IRA is for once you have employees to cover.
3.7 Robo-advisor or do it yourself?
The last setup question is whether to hand the whole thing to software. A robo-advisor like Betterment or Wealthfront builds and rebalances a diversified ETF portfolio for you, automatically, for a management fee of about 0.25% a year on its standard tier, charged on top of the underlying fund expense ratios. Do it yourself, buying a single total-market or target-date fund, and you pay only the fund’s expense ratio.
| Approach | Typical all-in annual cost | Effort | Best for |
|---|---|---|---|
| Single target-date fund (DIY) | ~0.08%-0.15% | Near zero | Total hands-off beginner |
| Three-fund DIY | ~0.03%-0.07% | Annual rebalance | Cost-minimizer |
| Robo-advisor | ~0.25% + fund ER | Near zero | Wants automation + tax features |
Data current as of June 2026.
On a $50,000 balance, that 0.25% robo fee is $125 a year, and over decades it compounds into real money against the DIY route. But the honest counterpoint is behavioral: the robo buys you automation and guardrails, and for someone who would otherwise never start, or who would panic-sell in the first crash, $125 a year to stay invested is cheap insurance. Our comparison of the top robo-advisors shows where each one fits. For a confident DIY beginner, a single low-cost fund wins on cost; for everyone else, the robo can be worth it.
You now have a broker chosen, your money’s protection understood, the funding order set, and the right account type picked for your income. The wrapper is sorted. The next question is what to actually pour into it, the specific mix of stocks and bonds that matches how long your money has to grow.
4. Building a Simple Portfolio That Matches Your Risk and Time Horizon
The wrapper question is sorted, the funding order is set, and you know a broad index fund is the core. So what mix of funds actually goes inside the account? The single lever that decides it is one you already met back in section 1.4: how long the money has to grow.
4.1 Time horizon sets the mix, and the three-fund portfolio that follows from it
Let’s reason by time horizon, because that is the lever doing most of the work. The longer you can leave the money alone, the more of it belongs in stocks, since a long runway turns those bear-market drops from a threat into a feature. Risk tolerance, your honest ability to not sell when the screen is red, is the second lever and the one that trims the first.
You will see a few rules of thumb for setting the split. The best known puts “110 minus your age” in stocks, with the rest in bonds (you will also see 100 or 120 minus age), then nudges the result for personal comfort. A 35-year-old lands somewhere around 75% stocks, 25% bonds on that formula. These are widely cited starting points, not official standards, so treat them as a sane default you adjust, not a rule handed down from on high.
Now the funds themselves. The three-fund portfolio is the workhorse: a US total-market fund, an international total-market fund, and a US total-bond fund. Three holdings, and you own essentially the entire investable world at a cost that rounds to nothing. Each one has a job:
- US total stock market (VTI or VTSAX, or an S&P 500 fund like FXAIX or SWPPX): the growth engine, the bulk of your long-run return.
- International stocks (VXUS as the ETF, VTIAX as the mutual fund): diversification beyond the US, so your result does not ride on one country’s decade.
- US total bond market (BND as the ETF, VBTLX as the mutual fund): the ballast that steadies the ride and gives you something stable to sell from in a downturn.
The donut below shows one concrete version for a 35-year-old: roughly 60% US stocks, 25% international, 15% bonds, with the tickers and expense ratios attached.
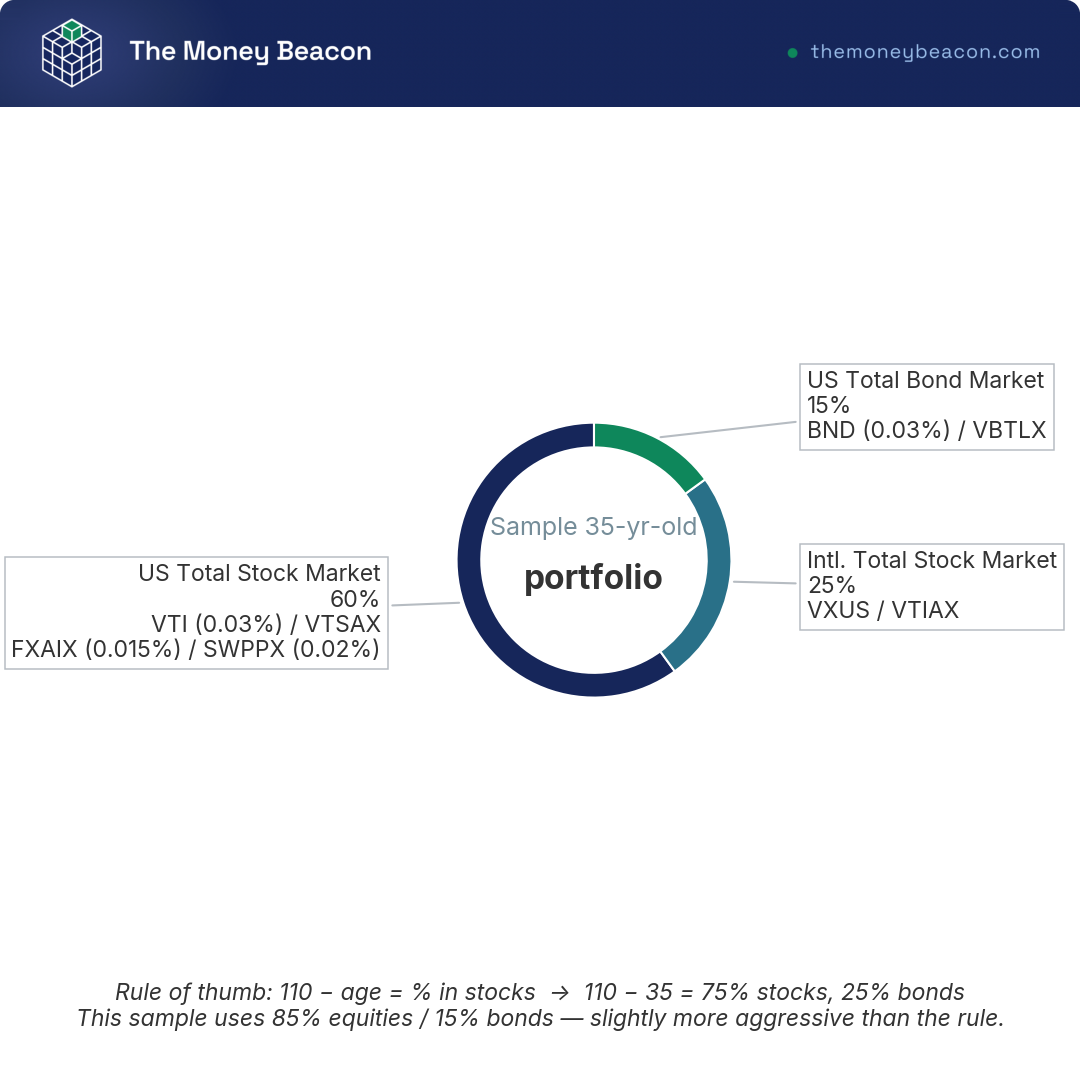
That 60/25/15 mix runs a touch more aggressive than the “110 minus age” formula would suggest, which is a deliberate call for someone young with a steady income and three decades ahead. The point is not the exact percentage; it is owning all three sleeves and keeping the cost near zero. Set your asset allocation by age and temperament, dialing the bond slice up if a 30% drop would genuinely make you sell, down if it would not.
4.2 Target-date funds: the one-decision portfolio
What if even three funds feels like two too many? Then you buy one. A target-date fund (TDF) holds an all-in-one global stock-and-bond mix in a single fund, and it automatically grows more conservative as its target retirement year approaches. That automatic drift toward bonds over time is called the glide path: a 2060 fund holds mostly stocks today and quietly shifts toward bonds as 2060 nears, with no action from you.
One purchase buys you a complete, self-rebalancing portfolio. That is the whole appeal for a beginner who wants to make exactly one decision and get on with life, and it is why target-date funds are the default in most 401(k) plans.
The one thing you have to check is the price tag. Index-based target-date funds are cheap (Vanguard’s run about 0.08%), but some actively managed versions charge several times that for the same convenience, so read the expense ratio before you buy. Done right, the move is simple: pick a single low-cost target-date fund with the year nearest your retirement, hold it inside a Roth IRA, and automate the monthly contribution. That is a finished portfolio in one line.
4.3 How much to invest, and why the emergency fund comes first
You know what to buy by now. The next question is how much, and the answer starts with money you should not invest yet.
Build the emergency fund before you buy a single share. Keep three to six months of essential expenses in an FDIC-insured high-yield savings account or a money market fund, walled off from your invested money, because stocks have a cruel habit of being down exactly when you lose your job and need the cash. The cash buffer is what lets you leave the portfolio alone through a crash.
Where each pot of money belongs comes down to the following four buckets:
| Cash bucket | Vehicle (asset class) | Why |
|---|---|---|
| Spending (this month) | Checking | Liquidity |
| Emergency fund (3-6 mo) | HYSA / money market fund | Safety, FDIC/NCUA on the HYSA |
| Short goal (<5 yr) | HYSA, CDs, T-bills/I bonds | Capital preservation |
| Long goal (10+ yr) | Stock index funds | Growth |
Only the bottom row belongs in the market. For the emergency fund and any near-term goal, stability beats growth, and a good FDIC-insured high-yield savings account does that job while still paying you something.
With the buffer funded, a common target is to invest 10% to 15% or more of your gross income for retirement. Stretch for the high end if you can, but do not let the perfect number stall you. Starting at 6% and automating it beats waiting a year to start at 15%, because the dollars you invest in your twenties are the ones with 40 years to compound. The exact percentage matters far less than making it automatic, which is the next problem to solve.
5. Dollar-Cost Averaging: Automating Your Contributions
You have the account, the funds, and a target percentage of income. Now the practical part: how do you get the money in, month after month, without staring at the market and second-guessing every purchase? The trick is to take your hands off the wheel entirely.
5.1 What dollar-cost averaging is, and how it compares with a lump sum
Dollar-cost averaging (DCA) is investing a fixed dollar amount on a fixed schedule, say $500 on the 1st of every month, no matter what the market is doing that day. When prices are low your $500 buys more shares; when prices are high it buys fewer. You never have to answer the question “is now a good time?”, because the schedule answers it for you.
Its real power is behavioral. It turns investing into a habit that runs on its own and keeps you from sitting in cash waiting for the “right” moment that somehow never arrives. It also matches how money actually shows up in your life, because most people invest a slice of each paycheck, not a single windfall.
Here is the nuance that trips people up, though. If you do have a lump sum (an inheritance, a bonus, a 401(k) rollover), the evidence says deploying it all at once usually beats easing it in. Vanguard’s research found that a lump sum invested immediately beat spreading it out in about 68% of historical periods across global markets, by an average of roughly 1.8% in a 60/40 example over a three-month window. The reason is simple: markets rise more often than they fall, so cash on the sidelines tends to drag. Past performance does not guarantee future results, but the math leans hard one way.
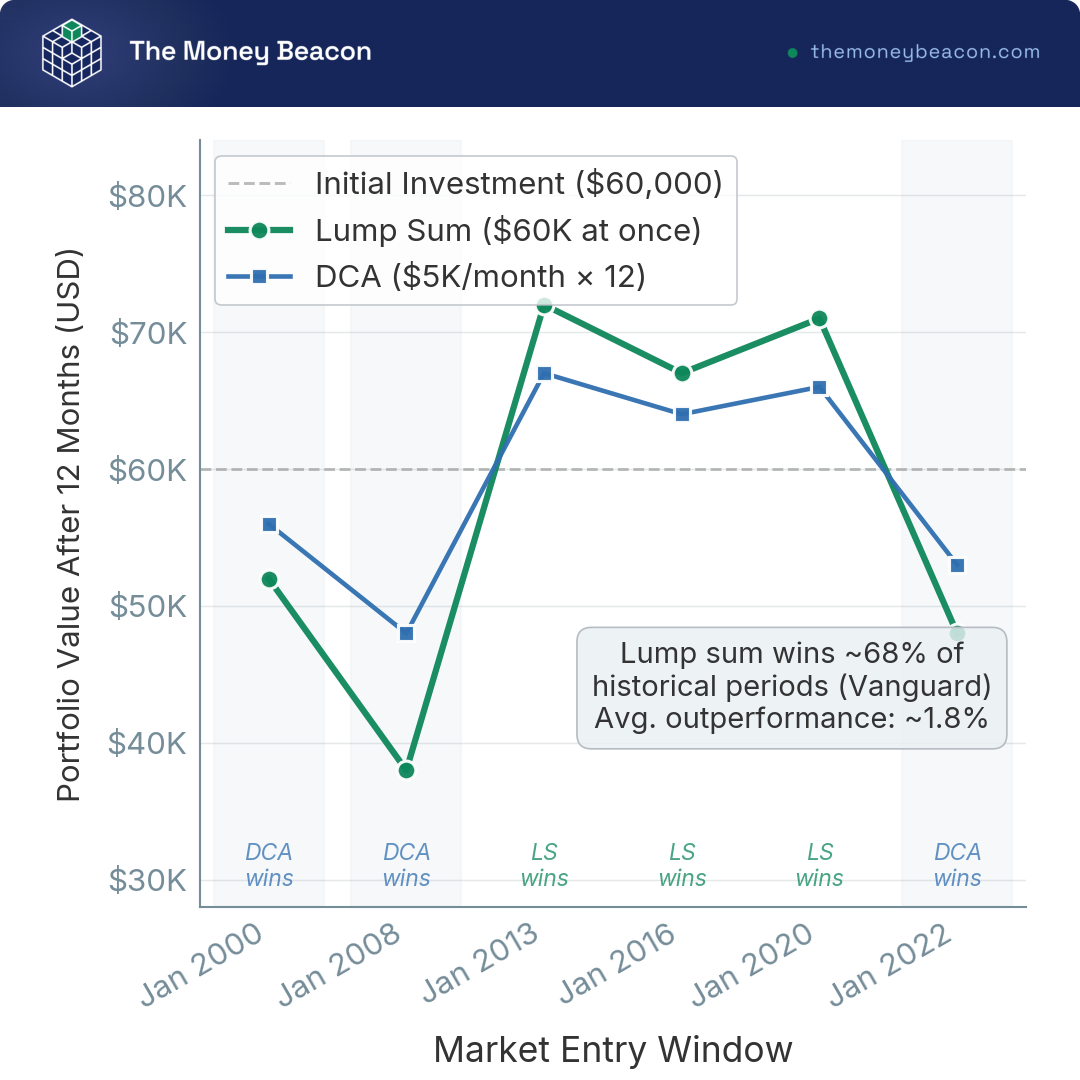
So the comparison is not lump sum versus DCA as life philosophies. DCA buys you lower regret and less bad-timing risk; the lump sum buys you a higher expected return. If you are investing from each paycheck, you are dollar-cost averaging by necessity, and that is exactly right.
Tom’s take
When I cashed out of my company I had a real lump sum to put back to work, and the textbook answer was to invest it all at once. I didn’t, not entirely. I fed a big chunk into my equity ETFs over several months, not because I thought I could time it, but because writing one enormous check the week before a possible drop is a regret I didn’t want to risk. The data says go all in; I paid up a little expected return to sleep at night, and I’d make the same call again.
5.2 Setting it up: ACH, auto-invest, and DRIP
So what do you actually click to make this run on its own? The setup is a short, one-time chore that then works in the background forever.
First, link your bank to the broker through ACH (Automated Clearing House), the standard bank-to-broker transfer rail. Second, set a recurring transfer, usually monthly on payday, so the cash lands without you thinking about it. Third, set the broker to auto-invest that cash straight into your chosen fund, so the money never sits idle. Fourth, enroll in DRIP so every dividend buys more shares automatically rather than piling up as cash. Set those four pieces once and the system runs itself.
Two timing notes so nothing surprises you. ACH transfers usually take one to three business days to settle, and that varies by broker, so the cash is not instant. US securities now settle T+1, meaning a trade finalizes one business day after you place it (the market shortened this from T+2 on May 28, 2024). Your first buy will not clear the same second you hit the button, and that is normal.
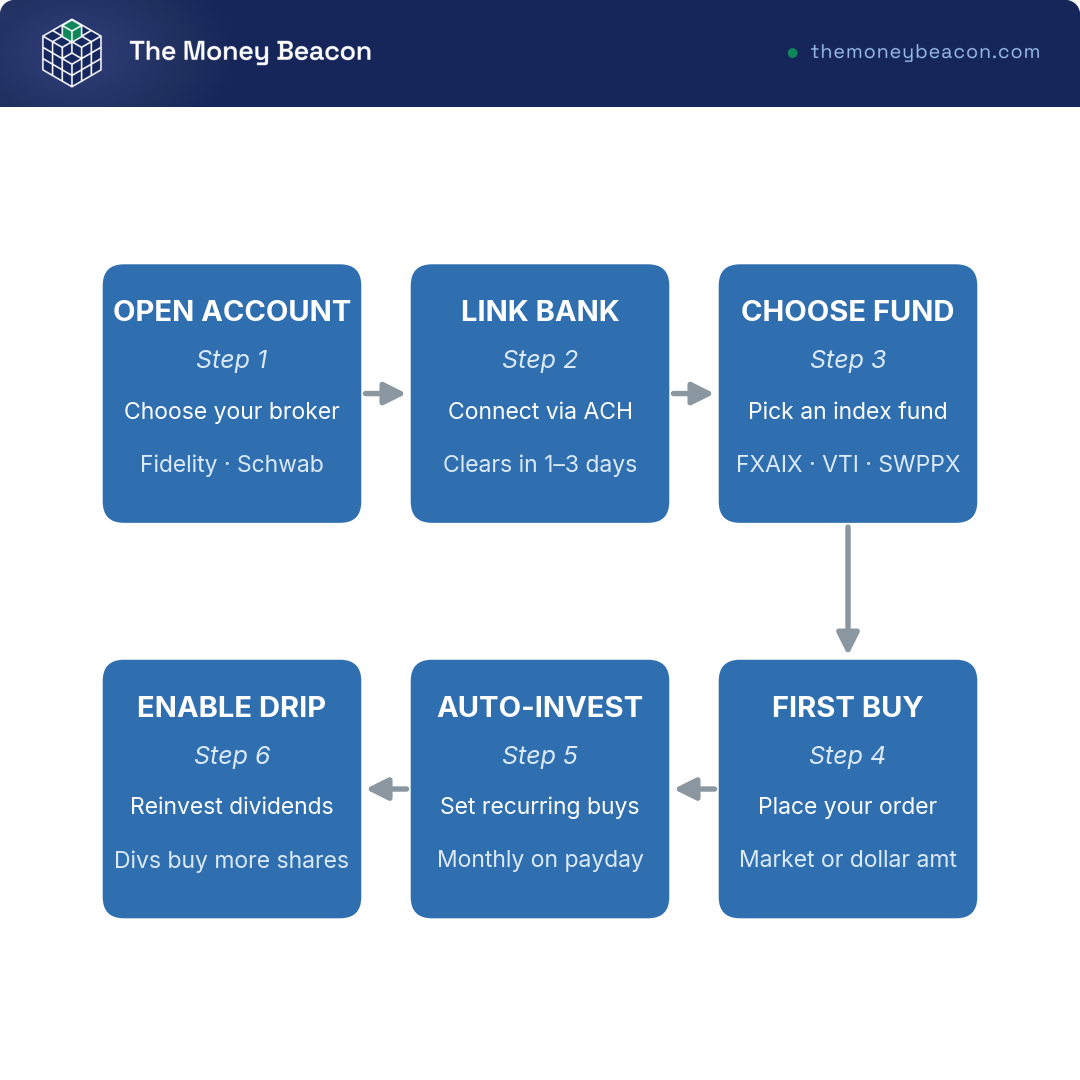
Work through that sequence once and you have built a machine that invests for you every month while you forget it exists, which is precisely the goal.
5.3 Why timing the market fails
Once the machine is running, the hardest part is leaving it alone, especially when headlines scream that a crash is coming. So here is the math that should keep your finger off the sell button.
Market returns do not arrive evenly. They cluster in a handful of explosive days, and those best days have an awful habit of landing right in the middle of the worst stretches, during the panic, often within days of a market bottom. Bail out to “wait for things to calm down” and you are almost guaranteed to miss them.
The numbers are stark. Over a multi-decade stretch, missing just the market’s ~10 best days can cut your final balance roughly in half versus staying fully invested. Miss the best ~20 days and you lose about three-quarters; miss the best ~30 and you give up around 84% of the result. You do not get those days back, and nobody rings a bell when they arrive. The rule that falls out of this is blunt: time in the market beats timing the market.
| Situation | Better choice | Reason |
|---|---|---|
| Investing each paycheck | DCA (automatic) | That is how the money arrives |
| Have a lump sum, high risk tolerance | Lump sum | Higher expected return (~68% of periods) |
| Have a lump sum, fear of a crash | DCA over 6-12 months | Reduces regret/timing risk |
The table sorts to one of three answers depending on where your money comes from and how a crash would make you feel, but in every case the machine keeps buying through the downturns, which is the whole reason you built it. The real threat to your returns from here is not the next crash; it is what you might do during it, and that is where the costliest mistakes live.
6. Taxes, Rebalancing, and Staying the Course
Your money is funded, automated, and quietly compounding in the background, so the hard part is behind you. But there is a difference between the return your funds earn and the return you actually keep, and the gap between those two numbers is taxes, drift, and your own behavior. So before we name the mistakes that cost the most, let us settle what the IRS takes, how to keep the portfolio on target without handing it an extra slice, and where the real traps hide.
6.1 How your gains and dividends are taxed
Here is the first thing to get straight: the same investment can be taxed three completely different ways depending only on the account it sits in. Inside a Roth IRA, qualified growth and withdrawals are tax-free, full stop; the fund can triple and you owe the IRS nothing on the way out, provided you are past 59½ and the five-year clock.
Inside a traditional IRA or 401(k), the tax is deferred while the money grows, then comes due as ordinary income when you pull it out in retirement. In a taxable brokerage account, there is no shelter at all, so you settle up as you go, on dividends every year and on gains the moment you sell.
Inside a taxable account, the rate hangs on one question above all: how long you held the position. Hold a fund for more than a year before selling and your profit is a long-term capital gain, taxed at 0%, 15%, or 20% depending on your taxable income. Sell inside a year and it is a short-term gain, taxed as ordinary income at rates that climb to 37%. That single line is the difference between keeping most of a gain and handing back a third of it, which is why a buy-and-hold index strategy is not just less work but genuinely cheaper.
The dollars make the point fast. Say you have a $10,000 gain on a fund and you sit in the 24% bracket. Sell at eleven months and it is short-term, so you owe about $2,400 in federal tax and keep $7,600. Wait past the one-year mark and that same gain is long-term at 15%, so you owe $1,500 and keep $8,500. Same fund, same profit, $900 more in your pocket for the price of a little patience. Multiply that across a lifetime of holdings and the case for never selling early writes itself.
Two precision points trip up almost everyone. Qualified dividends are taxed at the long-term rates (0/15/20%), not as ordinary income, so the steady payouts from a broad index fund are gentler on your tax bill than they look. And for high earners, the 3.8% net investment income tax (NIIT) stacks on top of the long-term rate once modified adjusted gross income clears $200,000 single or $250,000 married filing jointly, which pushes the top federal long-term rate to 23.8%, not a replacement of the 20%. Those thresholds are not adjusted for inflation, so over time they quietly catch more households.
| Income type | Holding period | Federal rate | Note |
|---|---|---|---|
| Long-term capital gain | > 1 year | 0% / 15% / 20% | Bracket depends on taxable income |
| Short-term capital gain | <= 1 year | Ordinary income (10% to 37%) | Never gets the LTCG rate |
| Qualified dividends | (met holding rules) | 0% / 15% / 20% (LTCG rates) | NOT ordinary income |
| Ordinary (non-qualified) dividends + interest | n/a | Ordinary income (10% to 37%) | Includes most bond/MMF interest |
| NIIT surtax | n/a | +3.8% on top | MAGI > $200k single / $250k MFJ |
Data current as of June 2026. State tax is separate and varies.
The upshot for you is simple and a little freeing. A broad index fund trades almost nothing, realizes few gains, and broad ETFs distribute very little along the way, so a low-turnover strategy held for the long run is naturally tax-efficient before you lift a finger. The federal rules run deep once you get into asset location and the finer points, and our guide to investment taxes covers every rule that matters for US investors, but the headline is that holding period and account wrapper do most of the work.
6.2 Rebalancing without overthinking it (or triggering a tax bill)
So your funds are growing at different speeds. What happens to the careful 60/25/15 mix you set up? It drifts. After a strong run for US stocks, that sleeve balloons past target and your portfolio is quietly carrying more risk than you signed up for. Portfolio rebalancing fixes that by selling a little of what grew and buying what lagged, restoring the target allocation and the risk level behind it. It is the rare move that forces you to sell high and buy low on a schedule, with no market call required.
You only need one of two methods, and neither asks much of you. The calendar approach means you check once a year, on a date you will remember, and nudge things back to target. The threshold approach means you act only when a sleeve drifts more than about 5 percentage points from its target, and otherwise leave it alone. So if your target was 60% US stocks and a strong year pushes it to 67%, that is past the 5-point line and worth a trim; at 63%, you do nothing. Pick one method and stick with it, because the discipline matters more than which one you chose. If you went with a target-date fund or a robo-advisor, this is already handled for you behind the scenes, which is a real part of what you are paying for.
Here is where 6.1 pays off. In a tax-advantaged account, rebalancing costs you nothing in tax, so you can trade freely back to target whenever a sleeve drifts. In a taxable account, selling an appreciated fund to rebalance can trigger a capital gain, so the smarter move is to rebalance with new contributions first, steering your fresh monthly money toward whatever sleeve is underweight until the mix self-corrects, no selling required. If you do have to sell in a taxable account, check that you have held the position more than a year so the gain qualifies for the lower long-term rate rather than the steeper short-term one.
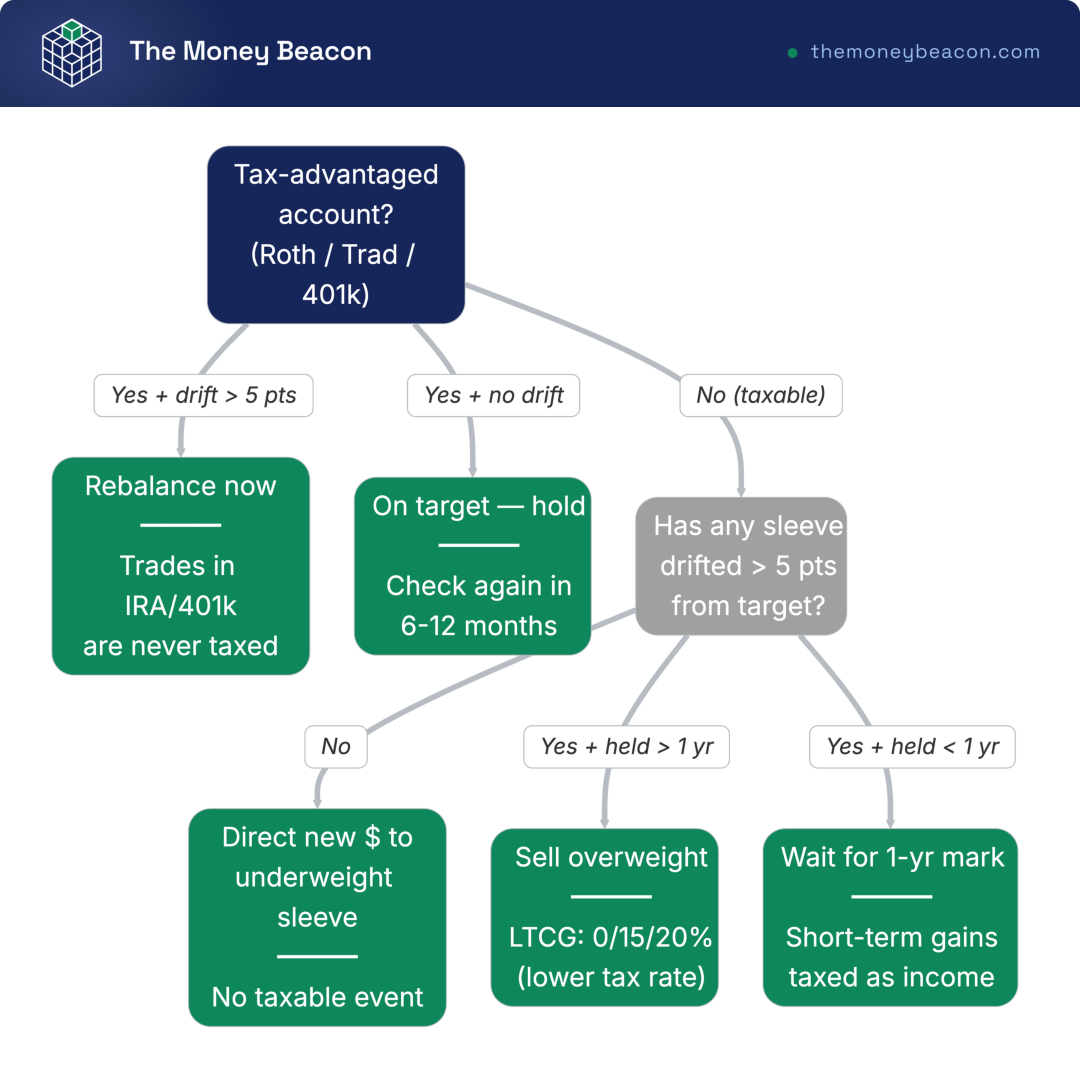
Follow the tree’s branches and you land on the same place every time: a portfolio back on target with the smallest possible tax bill.
6.3 Tax-loss harvesting, the wash-sale rule, and the behavioral mistakes that cost the most
There is a way to make a losing position do some work for you. Tax-loss harvesting means selling a fund that is down to lock in the loss, then using it to offset gains elsewhere or, if you have no gains to offset, up to $3,000 of ordinary income per year ($1,500 if married filing separately), with anything left over carried forward to future years. On a year when something in your taxable account is underwater, that loss is not wasted; it is a small tax asset. If you realize a $3,000 loss and you sit in the 24% bracket, that is roughly $720 shaved off your tax bill, all while your money stays invested in the market the whole time. None of this applies inside a Roth or a 401(k), and that is worth keeping straight.
There is one rule you cannot step on, and it has cost plenty of people the deduction they thought they had banked. The wash-sale rule disallows the loss if you buy back the same or a “substantially identical” security within 30 days before or after the sale. The fix is easy: sell one broad index fund at a loss and buy a different broad index fund that tracks a slightly different benchmark, so you stay invested through the 30-day window without breaking the rule. This only applies in taxable accounts, because inside an IRA or 401(k) there are no taxable gains or losses to harvest in the first place. The mechanics get fiddly fast, and our guide walks through tax-loss harvesting and the wash-sale rule in full if you want the edge cases.
All of that, though, is rounding error next to the real destroyers of return, which are not analytical at all. They are behavioral, and they are worth naming plainly because they cost beginners the most.
Panic-selling is the big one. Sell in a crash and you lock in the loss, then miss the rebound, which ties straight back to the best-days math from the last section: those explosive recovery days cluster right inside the panic, and bailing out is the surest way to miss them. Performance-chasing is the mirror image, piling into last year’s hot fund after it has already run, then watching it cool just as you arrive. Trying to time entries and sitting in cash “until things calm down” is the same mistake wearing a calmer face; the calm rarely arrives on schedule, and while you wait the market grinds higher without you. Overtrading turns investing into speculation, and the regulator draws a literal line here, since the FINRA pattern day trader rule flags four or more day trades in five business days in a margin account and requires you to keep at least $25,000 in equity, a clear sign you have left investing behind. And paying high fees is the one mistake fully inside your control, the only lever on this list you can pull to zero by simply choosing a cheap index fund and leaving it alone.
The pattern is obvious: every one of these is something you do, not something the market does to you. Which raises the only question left: what exactly do you do first?
7. Your First-Year Action Plan
You know the accounts, the funds, the automation, the tax rules, and the traps. What you need is sequence. So here is the entire guide compressed into a year-one playbook: the order to do things in, and the matching mistake to dodge at each step.
7.1 The first-year checklist: what to do and what to avoid
If you have read this far wondering how to invest in the stock market without it eating your life, this is the answer in seven moves, and the order matters as much as the steps, because each one earns more than the one after it. Start by clearing the ground: pay off any high-interest debt and build a three-to-six-month emergency fund, then capture your full employer 401(k) match, every dollar of it.
From there it is setup and discipline: open the right account, verify the broker, buy a broad index or target-date fund as your core, and automate the contributions. The table below pairs each move with the mistake it avoids.
Then comes the hardest step of all, and the one no checkbox can do for you: stay the course. Rebalance about once a year, ignore the alarming headlines, and do not panic-sell in a downturn. The first six steps are mechanical and you will finish them in an afternoon or two; the seventh runs for the rest of your investing life, and it is where the returns are actually won or lost.
| Step | To do | To avoid (common mistake) |
|---|---|---|
| 1. Foundation | Pay off high-interest debt; build 3-6 mo emergency fund in HYSA | Investing while carrying ~21% credit-card debt |
| 2. Match | Capture full employer 401(k) match | Leaving free match on the table |
| 3. Account | Open Roth IRA (if eligible) at a $0-commission broker | Confusing the account with the investment; leaving cash uninvested |
| 4. Verify | Check the broker on FINRA BrokerCheck | Assuming a brokerage is “FDIC-insured” |
| 5. Choose fund | Buy a broad index or target-date fund | Buying individual hot stocks as the core |
| 6. Automate | Set recurring ACH + auto-invest + DRIP | Trying to time each purchase |
| 7. Stay the course | Rebalance ~yearly; ignore headlines | Panic-selling in a downturn |
The full broker landscape, if you still need to choose where to open everything, sits in our comparison of the best online brokers for US investors.
7.2 The one-page recap: every decision and its default answer
If you remember nothing else, remember this table. Strip away every chart and worked example and how the stock market works for an ordinary saver comes down to a short list of beginner defaults, with the reasoning and the key 2026 figure beside each one.
| Decision | Beginner default answer | Why | Key figure (2026) |
|---|---|---|---|
| Before investing | Clear high-interest debt; build 3-6 mo emergency fund | Guaranteed return; stocks can crash when you need cash | Card APR ~21% |
| Which account first | 401(k) to the match, then Roth IRA, then 401(k), then taxable | Capture free match; tax-free Roth growth | Match often 50% on first 6%; IRA $7,500 |
| Which asset class | Broad low-cost index fund (total US / S&P 500), plus international and bond | Owns the whole market; beats most active funds | ER ~0.015% to 0.04% |
| ETF vs. index mutual fund | Either; mutual fund for native fixed-$ auto-invest, ETF for intraday/fractional | Same index, near-identical cost | $0 commissions |
| How much | 10% to 15%+ of income, automated | Habit plus compounding | $500/mo, 30 yr, 7% ≈ ~$610k |
| How to invest | Automatic monthly DCA; lump sum at once if you already have it | Removes timing emotion; lump sum wins ~68% of time | n/a |
| Taxes | Hold >1 yr; use Roth/IRA wrappers; harvest losses in taxable | LTCG 0/15/20% beats ordinary rates | Top LT rate 23.8% with NIIT |
| Biggest risks | Panic-selling, performance-chasing, high fees, timing | Behavior and fees are what you control | Missing ~10 best days ≈ halves return |
| Protection | Use SEC-registered, FINRA-member broker; verify on BrokerCheck | SIPC covers broker failure, not losses | SIPC $500k / $250k cash |
Data current as of June 2026.
Every line traces back to the same idea: own the whole market cheaply, in the right wrapper, on autopilot, and then mostly leave it alone. Investing is one move in a larger plan, and how you size contributions against retirement timelines is the natural next question, which our retirement planning guide walks you through, from how much you need to where to save it. Spreading the rest of your money across the right accounts and assets, so growth, safety, and access stay balanced, is its own discipline, and we lay out the framework in our guide to diversifying your savings.
Conclusion
Here is the part that should feel almost insulting after all that detail: the winning move is also the laziest one. Buy the whole market through a low-cost index fund, hold it inside a tax-advantaged account, add money on a schedule, and then do nothing. That is it. Almost all of the professionals who get paid full-time to beat the S&P 500 fail to do it. You are not going to outsmart them by reading more headlines, and you do not have to. You just have to own the market and stay out of your own way.
Because the hard part was never the technical part. Opening a brokerage account takes ten minutes, and picking a broad index fund or a single target-date fund is one decision. The real fight is behavioral: not panic-selling, not chasing last year’s hot fund, not sitting in cash waiting for a “better” moment that never announces itself. Bail out during a crash and you risk missing the explosive recovery days that land right next to the scary ones. Time in the market beats timing the market, every time you run the math.
So the lever you actually control is cost and consistency. A 1% fee can quietly eat $179,000 out of a $100,000 stake over 30 years. A $500 monthly habit at 7% turns about $180,000 of your own money into roughly $610,000. Past performance does not guarantee future results, but the playbook holds in every decade: cheap, diversified, automatic, and left alone.
Start this week. Clear high-interest debt, fund the emergency cushion, grab the full employer match, then open the account and turn on the auto-invest. If a Roth fits your income, our Roth IRA guide walks through the limits and the backdoor route for high earners, while our guide to investment taxes shows how to keep more of what those funds earn. And once the contributions are running on their own, our retirement planning guide helps you figure out how much you actually need and when you get to stop. The boring plan works. Go set it up.
Frequently Asked Questions
How much money do I need to start investing in the stock market?
Very little, and that is not a marketing pitch. Most major US brokers (Fidelity, Schwab, Vanguard, Robinhood) charge $0 commissions on stocks and ETFs, require no account minimum to open, and offer fractional shares so you can put $1 to work in a broad index fund. The practical floor is not a dollar amount; it is a small emergency fund of three to six months of expenses sitting in an FDIC-insured high-yield savings account so you are not forced to sell investments at the wrong moment. Once that cushion is in place and any high-interest debt is gone, $50 or $100 a month in an index fund is a real start, not a rounding error.
Is it better to invest in index funds or pick individual stocks?
For nearly every beginner, broad index funds win, and the evidence is not close. The SPIVA U.S. Scorecard (data through December 31, 2025) shows roughly 86% of professional active US large-cap fund managers underperformed the S&P 500 over 10 years, and about 90% over 15 years. An individual picking single stocks faces those same long odds plus far more concentration risk, because one bad company can do real damage when it is 20% of your portfolio instead of 0.05%. Index funds give you instant diversification across hundreds or thousands of companies at a cost of 0.015% to 0.04% per year at the major providers. If you want to own a few individual names, the defensible approach is to cap that sleeve at roughly 5% to 10% of your portfolio and keep it completely separate from the index-fund core.
What is the difference between an ETF and an index mutual fund?
Both can track the exact same index at nearly identical cost, so the choice is mostly mechanical. An ETF (exchange-traded fund) trades intraday on an exchange the way a stock does; you place a market or limit order and often can buy fractional shares. An index mutual fund prices once per day at its closing net asset value and natively supports automatic fixed-dollar investing, meaning the broker will invest exactly $300 a month without you having to count shares. Mutual funds sometimes carry minimums (Vanguard’s VTSAX is $3,000; many Fidelity index funds start at $0), while an ETF costs the price of one share or a fraction. For a beginner setting up a recurring monthly contribution, either format works well; the one that your broker supports for automatic fixed-dollar investing is the right one to pick.
Should I open a Roth IRA or a taxable brokerage account first?
A Roth IRA almost always comes first, once you have captured the full employer 401(k) match (that match is free money and nothing beats its immediate return). Qualified Roth withdrawals in retirement are completely tax-free, and your contributions (not earnings) can be pulled out at any time without tax or penalty, which gives new investors a useful safety valve. The 2026 contribution limit is $7,500, with a phase-out for single filers between $153,000 and $168,000 in income and for married filing jointly between $242,000 and $252,000; above those ceilings, the backdoor Roth is the legal workaround, subject to the pro-rata rule if you hold pre-tax IRA money elsewhere. One thing worth flagging clearly: a Roth IRA is an account, a tax wrapper. You still need to buy an index fund inside it. Open a taxable brokerage only after you have maxed the tax-advantaged space or need access to money beyond what your Roth contributions cover. Our Roth IRA guide walks through the income limits and the backdoor mechanics in detail.
Is dollar-cost averaging better than investing a lump sum?
It depends entirely on whether you have a lump sum to begin with. Vanguard’s research found that investing a windfall all at once beat spreading it out in about 68% of historical periods across global markets, by an average of roughly 1.8% in a 60/40 example over a three-month window. The reason is simple: markets rise more often than they fall, so cash sitting on the sidelines usually drags. That said, if the prospect of investing a large sum all at once causes real anxiety, spreading deployment over 6 to 12 months is a reasonable trade: you accept somewhat lower expected return in exchange for lower regret risk if prices fall right after you invest. If you are investing from each paycheck rather than deploying a windfall, you are already dollar-cost averaging by design, and that is exactly right. The habit of consistent, automatic contributions matters more than timing any single entry.
Do I have to pay taxes on money I make in the stock market?
In a taxable brokerage account, yes. You owe tax on dividends in the year they are paid and on gains when you sell. The rate depends on how long you held the position: long-term capital gains (assets held more than one year) and qualified dividends are taxed at the preferential federal rates of 0%, 15%, or 20%, depending on your taxable income. Short-term gains (held one year or less) and ordinary dividends are taxed at your regular marginal income rate, which runs from 10% to 37%. High earners add a 3.8% net investment income tax (NIIT) on top once modified AGI exceeds $200,000 for single filers or $250,000 for married filing jointly, bringing the top federal long-term rate to 23.8%. Inside a Roth IRA, qualified growth and withdrawals are tax-free. Inside a traditional IRA or 401(k), taxes are deferred until withdrawal, when they are taxed as ordinary income. Holding a low-turnover index fund for more than a year and keeping it inside a tax-advantaged account where possible is the most efficient structure available to most investors. Our investment taxes guide covers the wash-sale rule and tax-loss harvesting for taxable accounts.
How long should I keep my money invested in the stock market?
Stocks are for long horizons, ideally 10 or more years and at an absolute minimum around five. The US market has had down years roughly one in four and has seen declines of 20% or more (a bear market) roughly once every eight to ten years; it has historically recovered and reached new highs given enough time, but short-term losses are real and recovery is not guaranteed in any given window. Money you might need within five years belongs in a high-yield savings account, a money market fund, CDs (certificates of deposit), or short-term Treasurys, not in stocks. The longer your time horizon, the more room you have for downturns to recover and for compounding to work. Missing roughly the market’s 10 best days over a multi-decade period can cut the final portfolio value roughly in half versus staying fully invested, which is the sharpest argument for buying and holding through volatility rather than trying to sidestep it.
What is the safest way for a beginner to invest in stocks?
Start with the foundation: pay off any high-interest debt (the average credit card APR ran about 21% in early 2026, a guaranteed return no index fund can reliably beat) and build a three-to-six-month emergency fund in an FDIC-insured savings account before a single dollar goes into the market. From there, open an account at a registered broker (verify it on FINRA BrokerCheck), fund a Roth IRA or capture your employer’s 401(k) match first, and buy a single broad, low-cost index fund or a target-date fund inside that account. Automate a fixed monthly contribution so the decision is made once, not every month. Keep in mind that brokerage accounts are not FDIC-insured; the Securities Investor Protection Corporation (SIPC) covers up to $500,000 in securities and cash against broker failure, but no protection exists for ordinary market losses. The two variables fully in your control are fees and behavior. Keeping costs near zero and staying invested through downturns is the entire playbook.




Comments
Questions and corrections welcome. We read everything.